OVERVIEW
It was a big week on Wall Street as all three major U.S. stock indices rallied. The S&P 500 gained 2.5%, the Dow surged 2.9%, and the Nasdaq climbed 2.85%. Smaller-sized companies saw even bigger gains, skyrocketing about 5.8% for the week.
Foreign stock markets did similarly well. Developed country markets rose 2.55%, and emerging markets gained about 2.65%.
Bonds had a good week. The Fed said they anticipate cutting rates up to three times next year, and market yields fell in response. The 10-year dipped below 4%, settling at about 3.9% on Friday, and long-term Treasury prices surged more than 5%.
Over in the real asset space, commodities rose about 1% broadly, and real estate surged roughly 5.5%. Oil climbed 0.9%, gold rose 1.05%, and corn fell about 0.5%. And finally, the U.S. dollar weakened about 1.3%.
KEY CONSIDERATIONS
Fed Pivot – Well, the Fed gave the market what it wanted to hear last week. Here’s Fed Chairman Jerome Powell:
“I would say there’s a general expectation that [rate cuts] will be a topic for us looking ahead.”
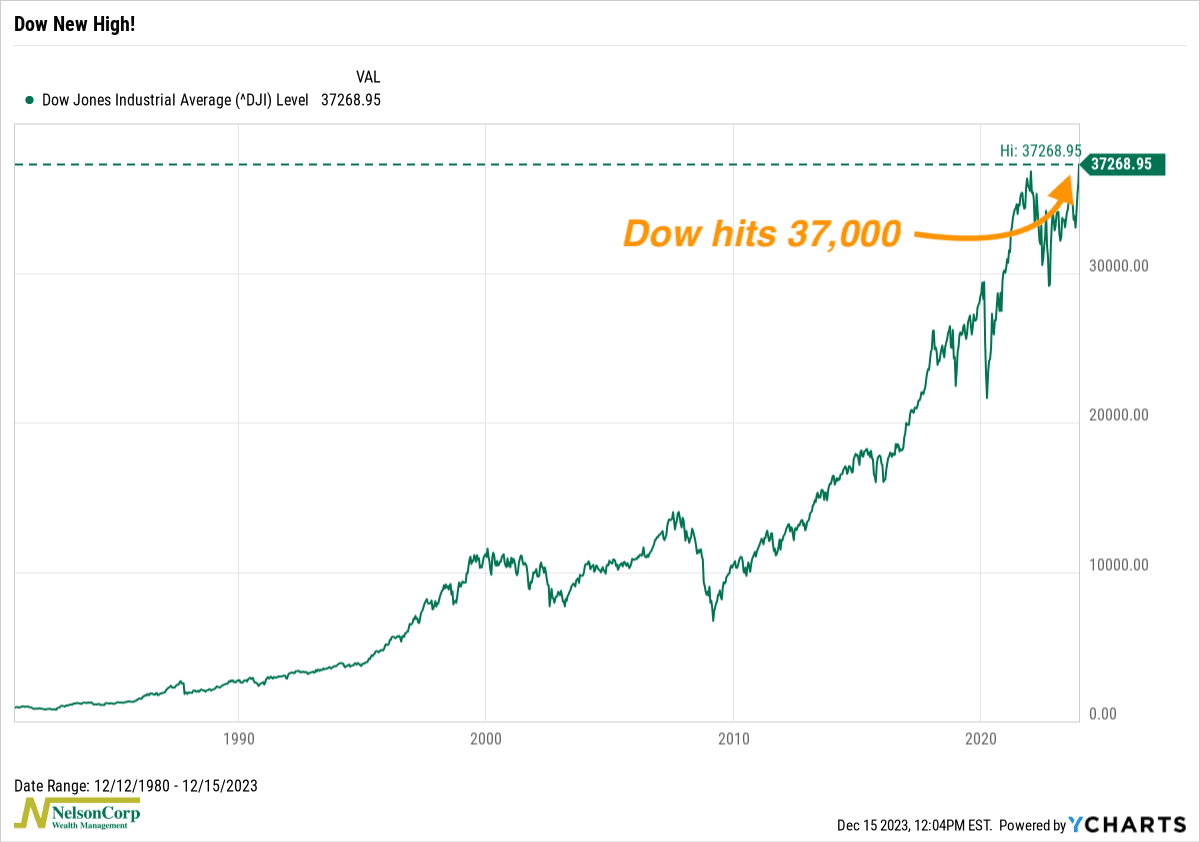
Yep, the market took that as a green light and ran with it. The Dow Jones Industrial Average (what many people think of when they hear “the market”) broke 37,000 for the first time, a new record high!
Of course, interest rates fell, too. The benchmark 10-year Treasury rate dipped below 4%, which is pretty crazy to think about as it was trading near 5% just two months ago.
This was good news for our Long-Term Treasury Bond Yield indicator, which measures the 3-week moving average of long-dated Treasury bond yields. As you can see on the chart below, this measure fell from a peak of 4.95% a month and a half ago to 4.45% last week. That’s a 10% percent drop, good enough to generate a buy (bullish) signal.
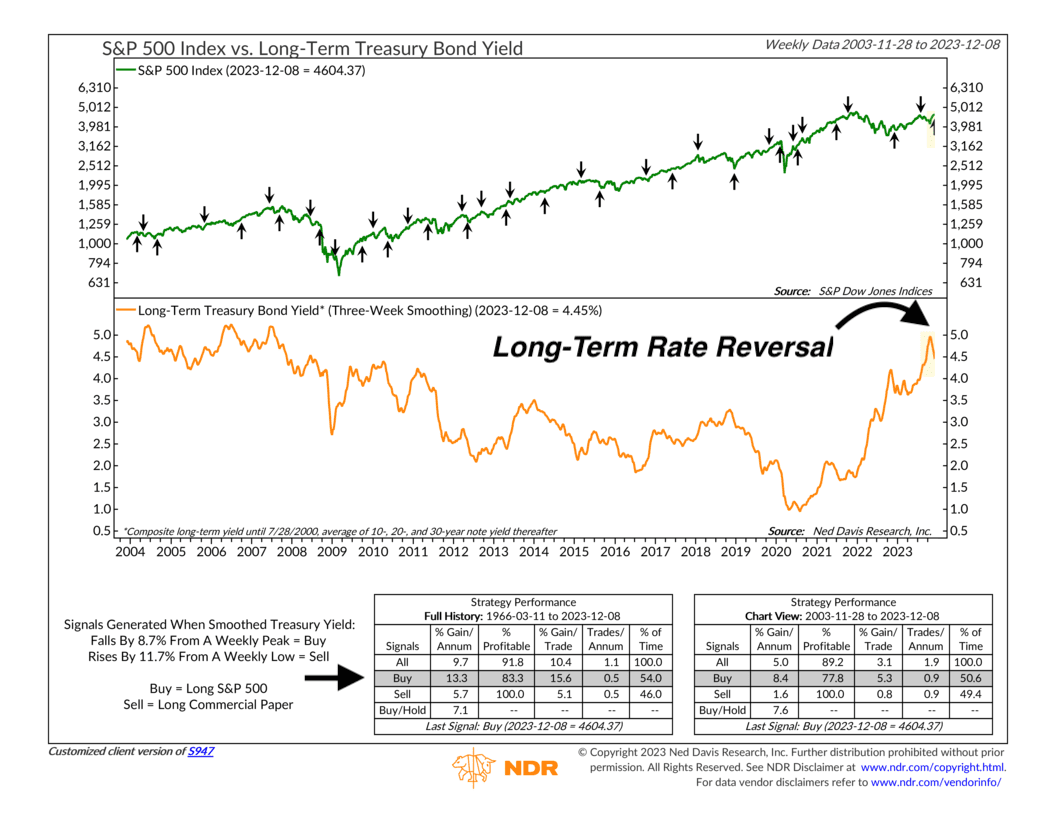
That’s great news for stocks. Why? Because the market loves falling rates, and historically, the stock market performs the best when this indicator says long-term rates are falling.
Another good sign? More and more stocks continue to participate in the stock rally. The equal-weight version of the S&P 500 Index—which, as the name implies, gives an equal weighting (0.2%) to every member of the index, regardless of size—recently hit a 21-month high.
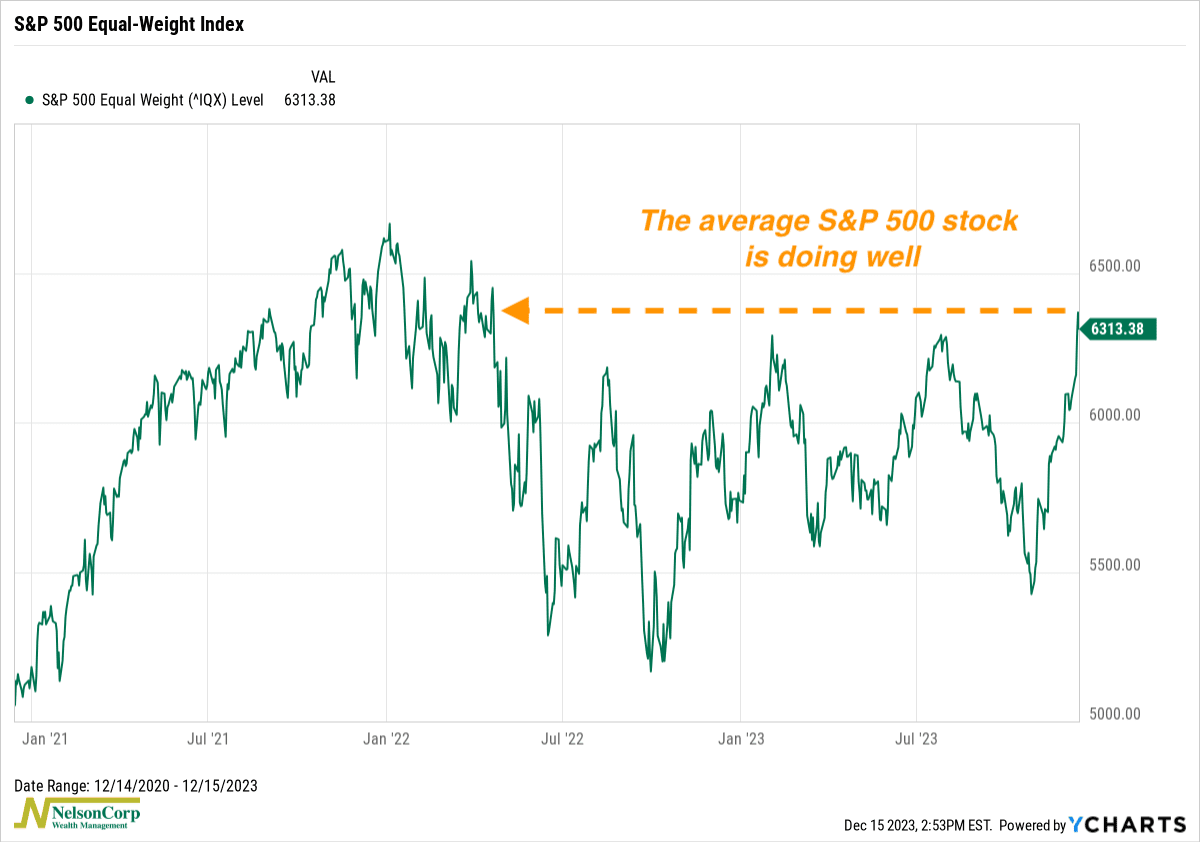
In other words, the average stock seems to be doing quite well lately—and that’s encouraging news.
However, that does raise the question: Have we reached max euphoria?
This next chart shows that investors have been pouring money into the stock market at a blistering pace. Specifically, it shows the 4-week total flows into U.S. equity ETFs as a percentage of total market cap. As you can see, it’s currently at extremely high levels.
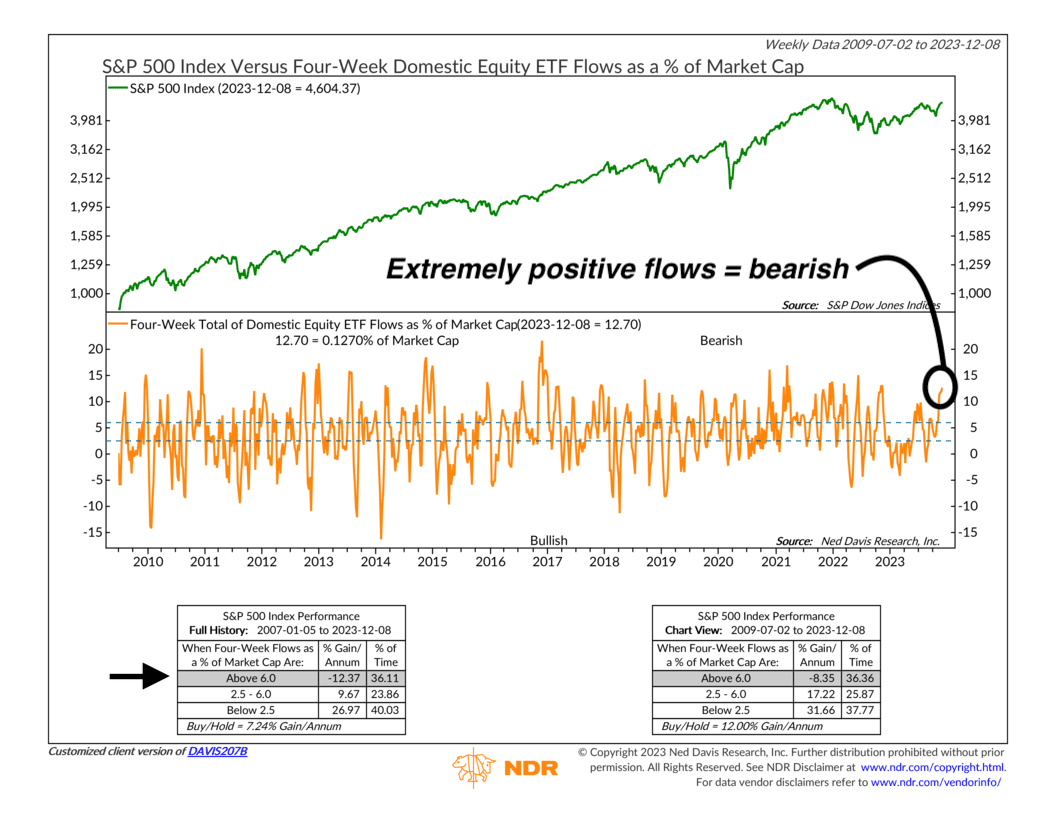
While you might think this is good—it’s actually bad. If everybody is positioned bullish, who else is left to buy? Extreme levels of optimistic positioning like this tends to be bearish (negative) for stock prices, and that’s exactly what the historical record of the indicator says, as the S&P 500 tends to have negative annualized returns when fund flows are in the upper extreme zone.
So basically, while the market bulls are charging ahead, we think that extreme sentiment levels will likely temper returns a bit going forward, at least in the short term.
However, the bottom line is that the Dow just hit an all-time high. And the other major indices aren’t far behind. That is typically a pretty bullish time to be invested.
This is intended for informational purposes only and should not be used as the primary basis for an investment decision. Consult an advisor for your personal situation.
Indices mentioned are unmanaged, do not incur fees, and cannot be invested into directly.
Past performance does not guarantee future results.
The S&P 500 Index, or Standard & Poor’s 500 Index, is a market-capitalization-weighted index of 500 leading publicly traded companies in the U.S.
The post Fed Pivot first appeared on NelsonCorp.com.