OVERVIEW
The Dow and the S&P 500 posted their second weekly gain in a row last week, increasing 2.08% and 0.69%, respectively. The Nasdaq, however, finished the week lower by 0.57%.
Earnings season is well underway in the U.S., and solid results for many of the Dow stocks helped drive the index to 10 straight positive trading days in a row. On the other hand, some of the earnings data from two of the biggest companies in the Nasdaq fell short of expectations, which helps explain the index’s underperformance for the week.
Foreign stocks had a down week, highlighted by a report showing that China’s economy is expanding less quickly than expected. Developed country stocks fell 0.6%, and emerging markets dropped 1.35%.
Government bond yields held steady last week as investors looked ahead to the Federal Reserve’s meeting this week. The 10-year Treasury rate was essentially unchanged from the prior week at about 3.8%.
Commodities had a strong week, rising about 1.5% broadly. Oil increased 2.25%, gold edged higher by 0.11%, and corn surged 4.05%. These gains came despite a 1.23% increase in the value of the U.S. dollar.
KEY CONSIDERATIONS
Trending Bullish – The stock market continued its trend of moving in a bullish direction last week. After last week’s gain of 0.69%, the S&P 500 is now just about 5.5% away from its all-time high set on January 3rd, 2022.
We pointed out why this is a bullish condition for stocks in our Indicator Insights blog post this week. But to give you another visual, here’s what the S&P 500’s drawdown chart looks like currently.
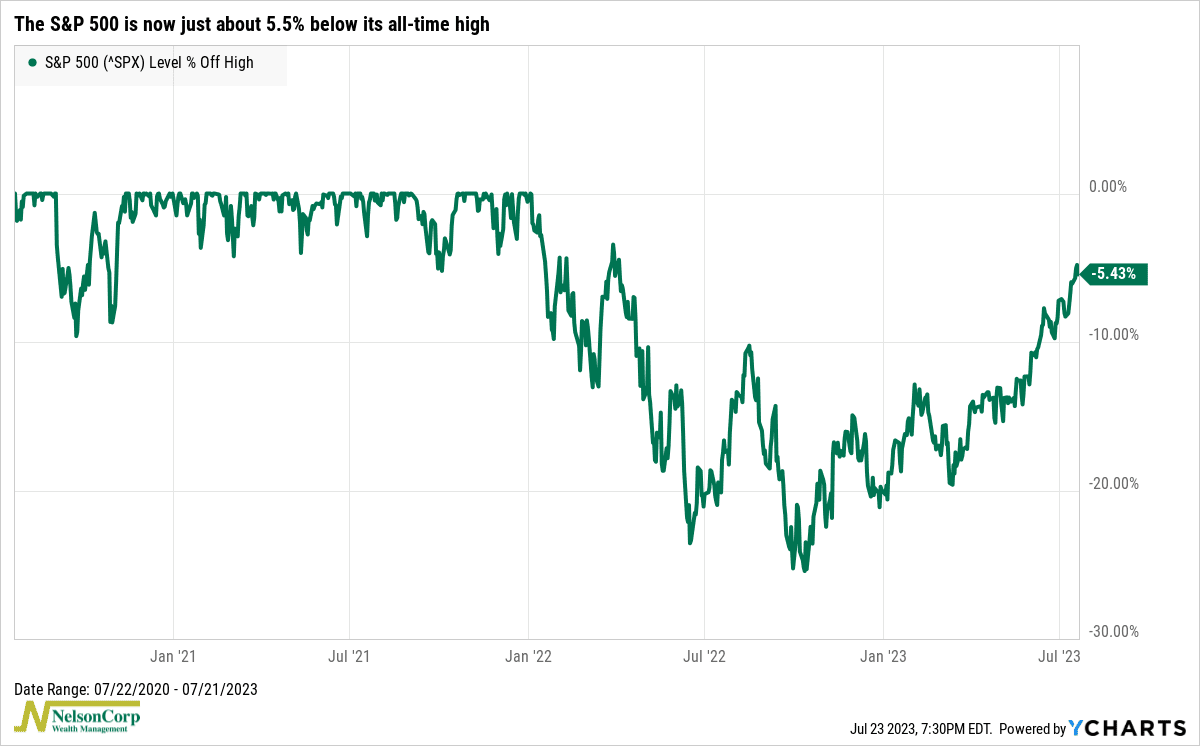
Not bad. It really seems like the pessimism and price weakness from last year has given way to optimism and price strength this year.
In fact, optimism is taking off like a rocket. As this next chart shows, bullish sentiment among retail investors recently hit its highest level in over two years.
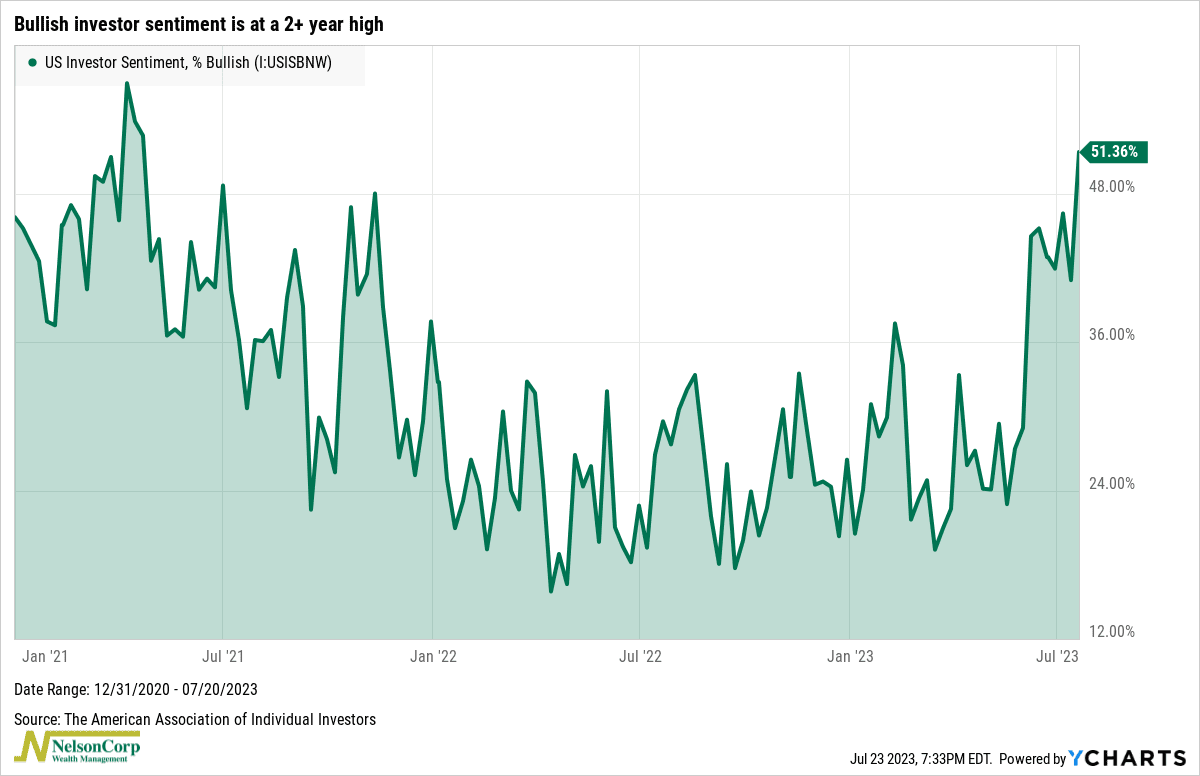
These so-called “animal spirits” are driving stock returns higher, and this has translated into improvements in a number of indicators that we utilize to model stock market risk.
In particular, a very important indicator that we use to measure stock market momentum recently climbed into its most bullish zone, shown below.
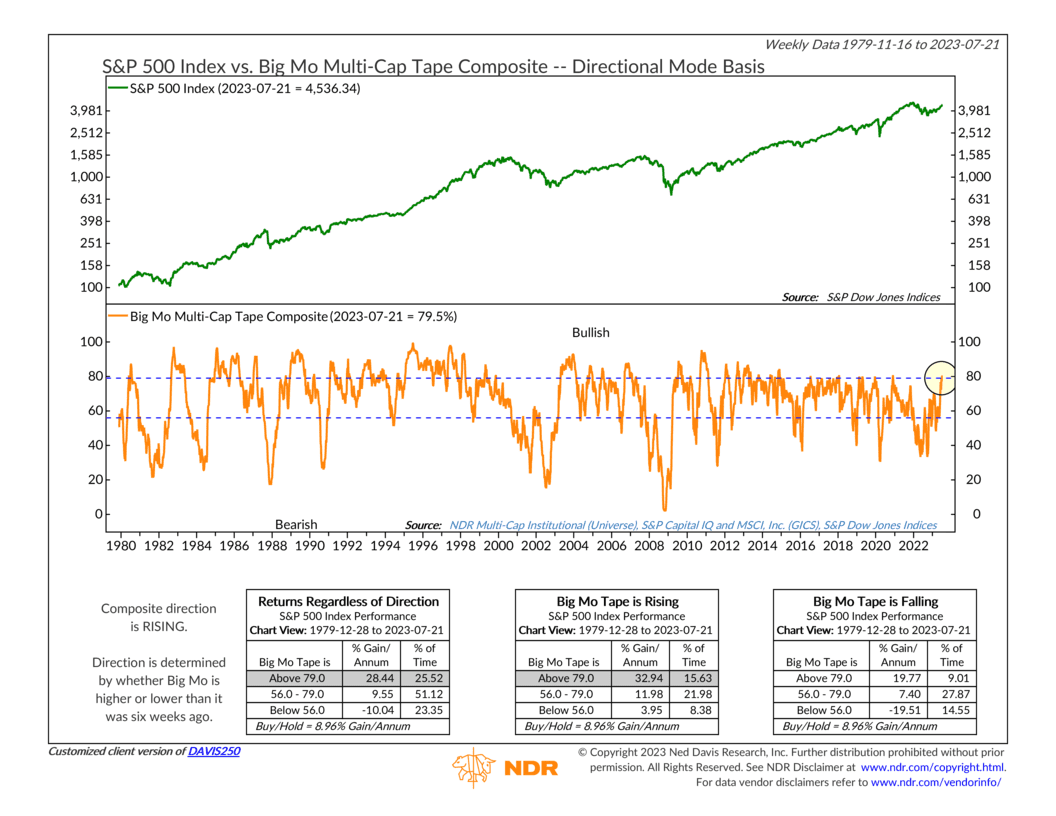
This “Big Momentum” indicator measures the price-trend and momentum performance of numerous stock market sub-industries and combines them into one reading. When this reading gets above 79%, like it recently did, it has historically coincided with the strongest returns for the S&P 500 on record, going back to 1980.
So that’s all good news. But the weird thing about all this bullish price action and optimism is that it doesn’t really have much to do with corporate fundamentals. For the most part, investors aren’t exactly expecting corporations to bag fatter profits in the immediate future. In fact, Wall Street analysts think S&P 500 companies will see their earnings per share rise just 1% in 2023.
So, what is driving this year’s gains? Well, it appears as if it’s good ole’ fashioned multiple expansion. In other words, investors are simply willing to pay more for stocks than they previously were.
As the chart below shows, the S&P 500’s forward price-to-earnings (P/E) ratio has climbed to roughly 21 from about 17.5 to start the year. That roughly 20% gain essentially matches the S&P 500’s gain for the year.
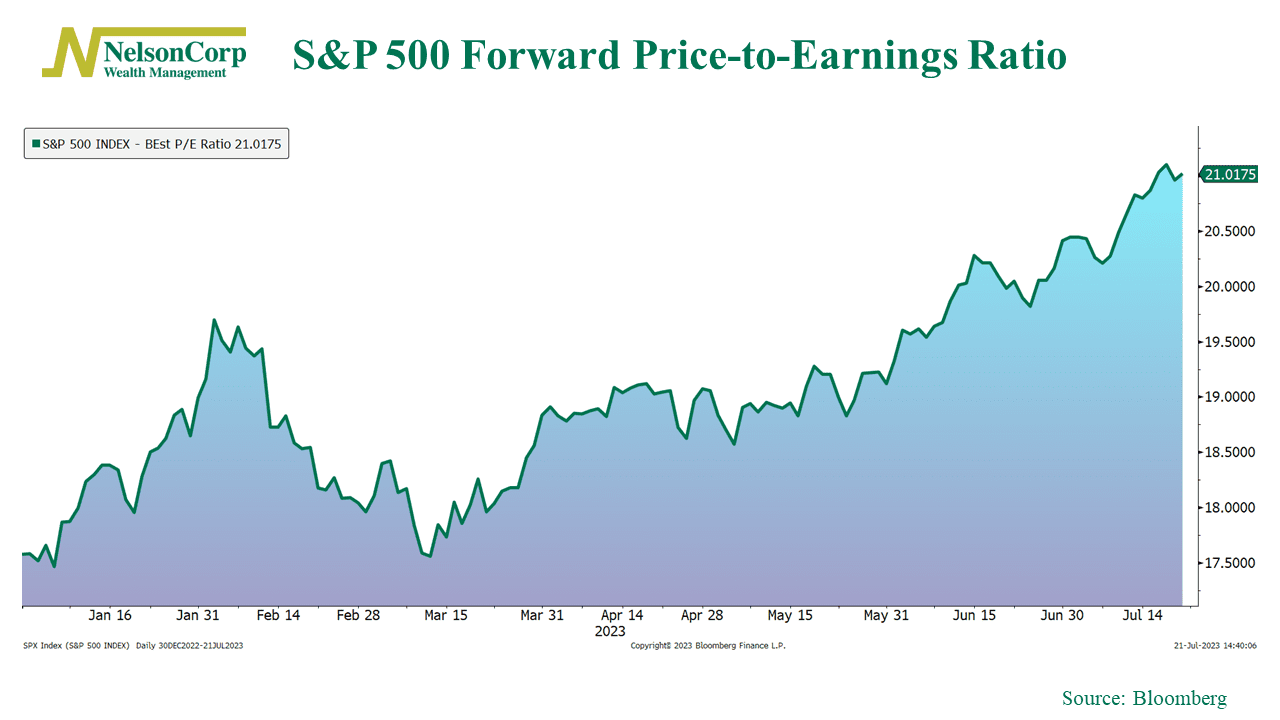
Historically, a P/E ratio of 15 is considered average or “fairly valued.” So, maybe stocks have run up a bit too quickly? Or perhaps the market expects a reacceleration in earnings growth later this year or next.
We’ll have to see how this shakes out. But for right now, the weight of the evidence continues to favor a more bullish positioning.
This is intended for informational purposes only and should not be used as the primary basis for an investment decision. Consult an advisor for your personal situation.
Indices mentioned are unmanaged, do not incur fees, and cannot be invested into directly.
Past performance does not guarantee future results.
The post Trending Bullish first appeared on NelsonCorp.com.