OVERVIEW
Last week, the U.S. stock market experienced a mix of movements. The VIX Index, which measures volatility, decreased by approximately 7.7% to a level of 22. The S&P 500 Index decreased by 0.2%, the Nasdaq Composite fell by 1.94%, but the Dow Jones Industrial Average gained 0.86%. Value stocks performed better than growth stocks, gaining 0.82% while growth stocks fell by 1.28%.
Foreign stocks also showed a mix of movements, with the MSCI EAFE Index of developed country stocks increasing by 0.36% and the MSCI EM Index of emerging market stocks decreasing by 0.26%.
In the bond market, prices generally decreased with the yield on the 10-year Treasury note rising to 3.75%, up from the previous week’s close of 3.5%. Intermediate and long-term Treasuries decreased by 1.4% and 4.65%, respectively, and investment-grade corporate bonds decreased by 1.65%. High-yield (junk) bonds also dropped by 0.44%.
Real estate decreased by 1.61% for the week, and commodities also fell slightly by 0.14%. Oil gained 6.81%, gold increased by 0.22%, and corn rose by 2.03%. The U.S. dollar decreased by 1.17% against major world currencies.
KEY CONSIDERATIONS
The Drawdown Dance – The U.S. stock market has had a wild ride this year, with no shortage of ups and downs.
One trend that has emerged is the occurrence of multiple multi-week drawdowns, where the S&P 500 Index experiences a significant drop over a prolonged period of time.
In fact, as the chart below reveals, there have been a total of five such drawdowns this year—and we are currently in the middle of a sixth one.
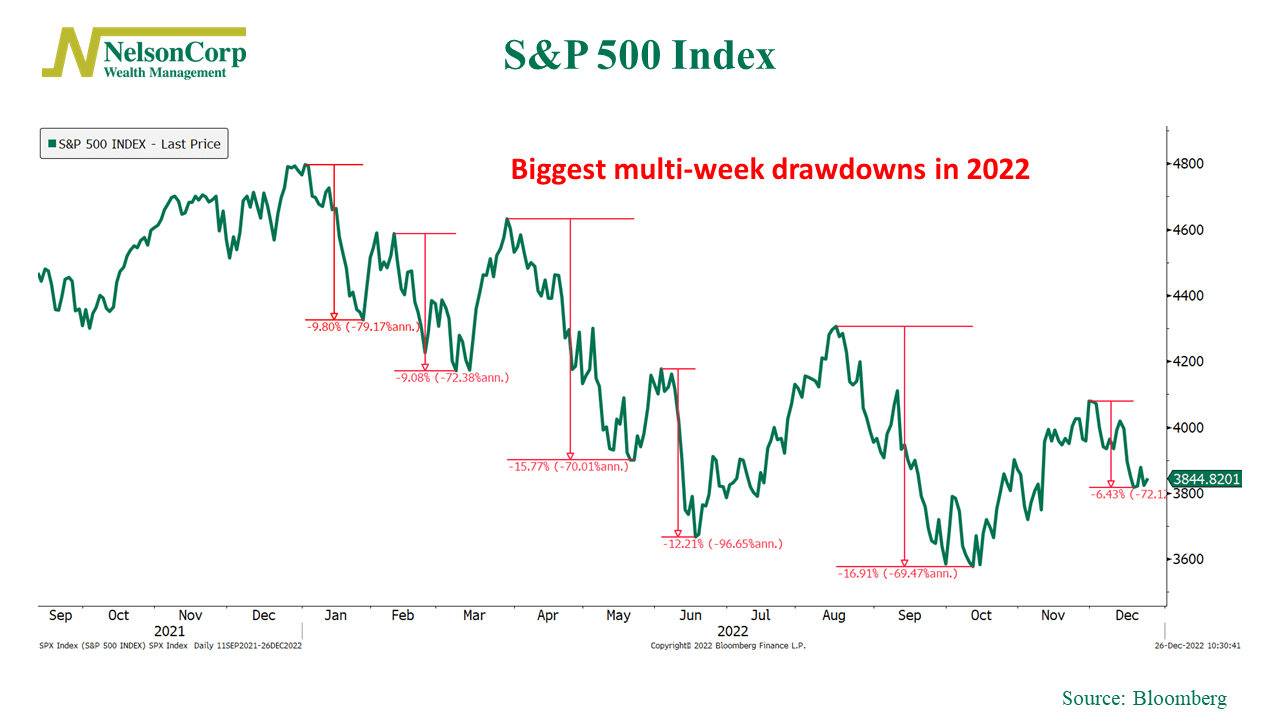
But these drawdowns aren’t occurring during a broader bull market. As you can see from the chart, the market’s overall trend is down. In other words, each new drawdown has resulted in the S&P 500 reaching a new low for the year.
I like to think of this as the ‘drawdown dance,’ where the stock market takes one step forward and then two steps back. This is the type of price action one sees in a bear market. It’s essential to understand this because when the market is dancing like this, it is harder for the price action component of our stock market risk model to see much improvement.
And that’s the key insight. Price action is the most important variable that we track because it reflects the collective judgment of all market participants about the value of the stock market. It combines everything that matters—fundamentals, technicals, sentiment—into one all-important metric: the price.
In other words, it’s a critical piece of the stock market puzzle. And ultimately, it will give us the clearest indication of when it is a good time to increase (or decrease) exposure to stocks. But, right now, that risk is still elevated.
This is intended for informational purposes only and should not be used as the primary basis for an investment decision. Consult an advisor for your personal situation.
Indices mentioned are unmanaged, do not incur fees, and cannot be invested into directly.
Past performance does not guarantee future results.
The post The Drawdown Dance first appeared on NelsonCorp.com.