OVERVIEW
U.S. stocks were in the green once again last week. The S&P 500 posted its third weekly gain in a row, rising about 1%, and the Nasdaq added about 2%. The Dow ended its 13-day winning streak on Thursday but still finished the week higher by about 0.67%.
Growth stocks led the rally, rising about 1.6% versus the 0.35% gain for value stocks. Small caps added about 1.15% for the week. Foreign stocks also moved higher, with developed countries gaining 0.9% and emerging markets surging 2.82%.
As expected, the U.S. Federal Reserve hiked its benchmark rate another quarter-percentage point last week to between 5.25% and 5.5%, its highest level since 2001. In return, the 10-year Treasury yield closed above 4% on Thursday. It pulled back on Friday but was still well above the previous week’s closing level of 3.85%. Bond prices were mostly down across the board as a result.
Over in the real asset space, commodities gained nearly 1% broadly. Oil surged about 4.5%, while gold fell 0.27% and corn dropped 1.14%. Real estate was down about 1.7%. And the U.S. dollar strengthened about 0.75% against the world’s major currencies.
KEY CONSIDERATIONS
The Dow’s Bullish Scent – It’s been a pretty good summer for the U.S. stock market. Here’s how the three major U.S. stock indices have performed since June 1st.
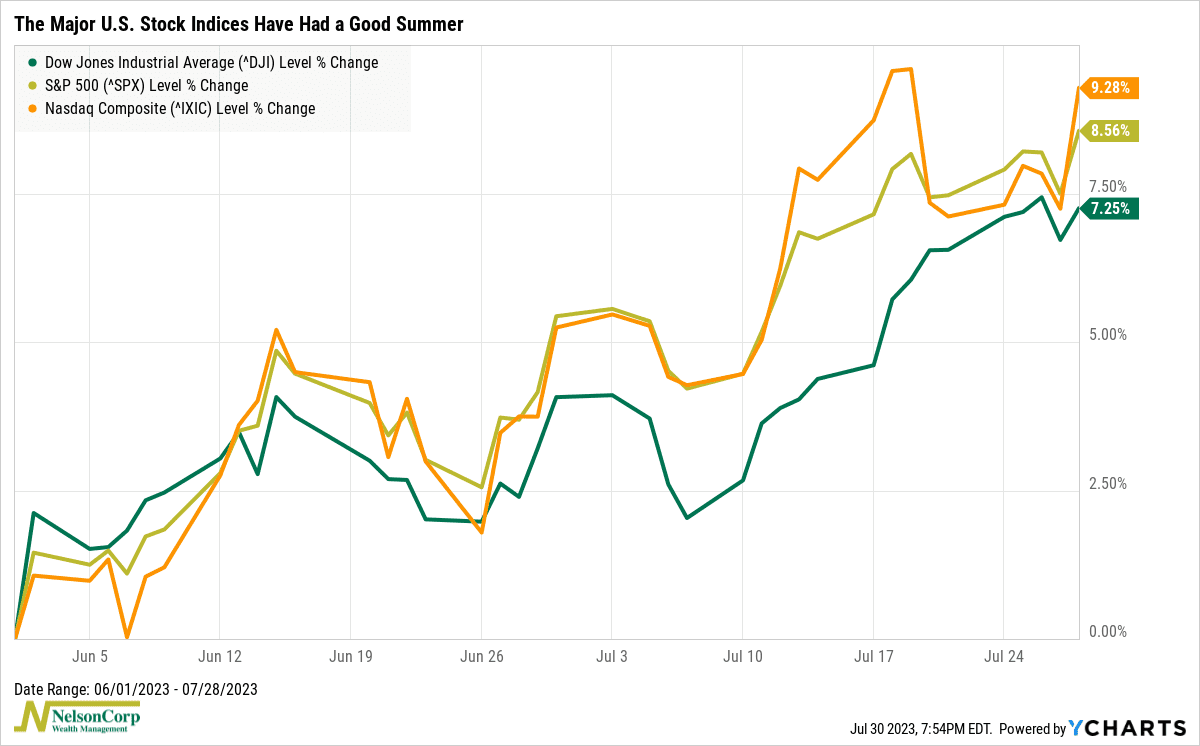
Not bad. But what’s interesting about that chart is that the Dow—while still lagging—has pretty much kept pace with the other two indices. That’s in sharp contrast to what the returns look like year-to-date.
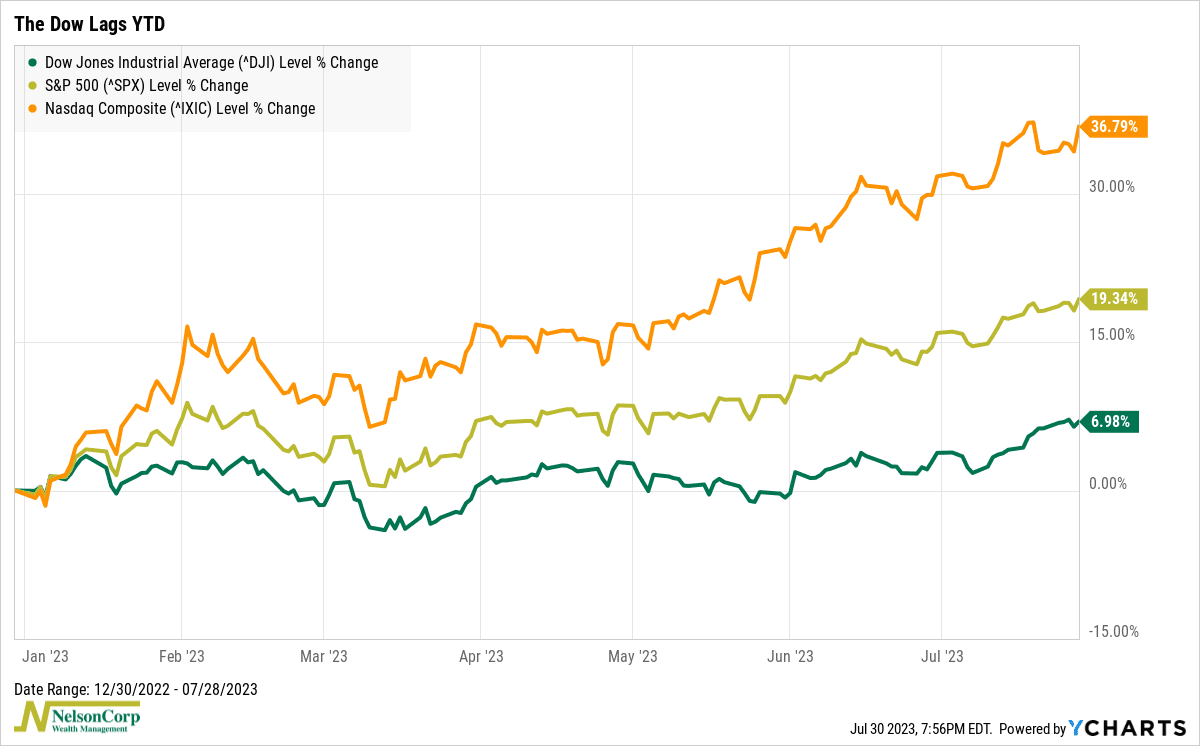
It’s good news that the Dow is finally starting to keep up with the rest of the market. We call this “increased breadth,” and it’s typically a bullish sign for the overall stock market.
When it comes to the Dow in particular, one area that this is showing up is in the Dow Transports Average confirming the price action of the Dow Industrials Average. This is related to the well-known Dow Theory, which contends that the market is in an upward trend if both the Dow averages (the transports and industrials) are in uptrends.
The chart below illustrates this nicely by comparing the Dow Industrials and the Dow Transports to their respective 200-day moving averages. As you can see, both are trending well above their averages—a bullish sign historically.
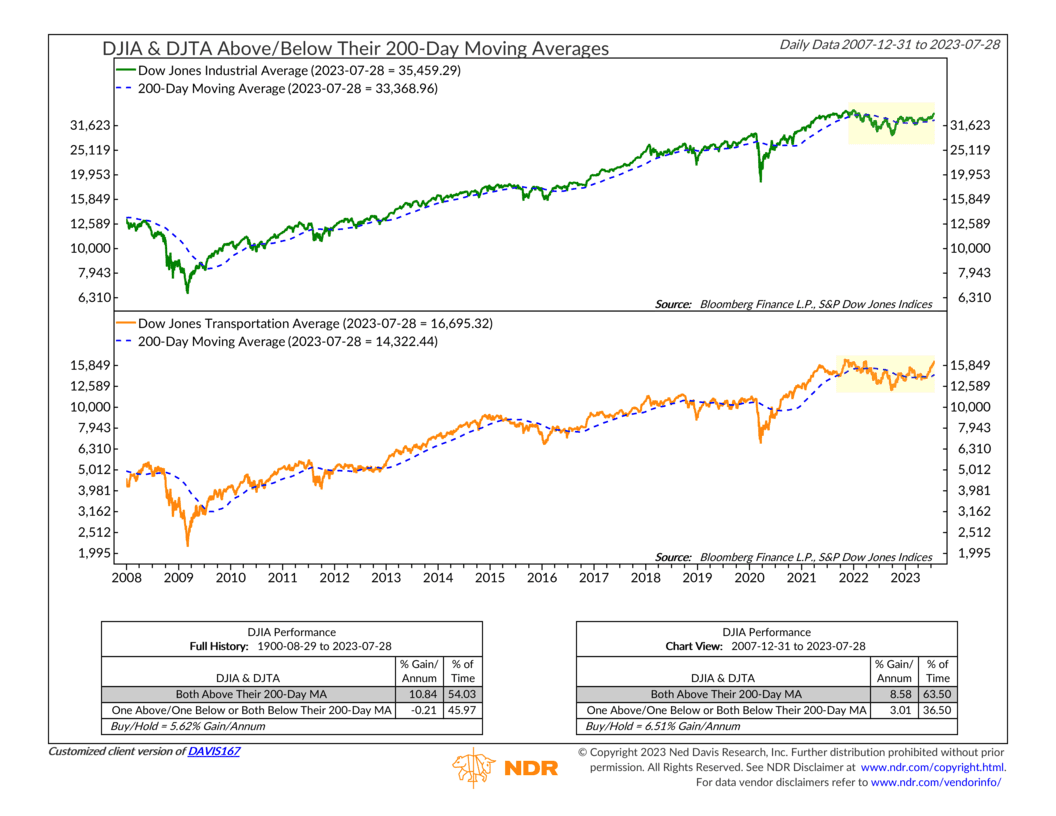
Furthermore, if you look at the Dow Transports Average (orange line, bottom clip), you can see how strongly it has performed lately. The Dow itself is close to breaking out to a new all-time high, and so is its corresponding transportation index. From a technical perspective, this smells bullish.
With that said, however, if we had to find one area of the risk landscape that doesn’t smell so good, it would be in our Overbought/Oversold Composite, shown below.
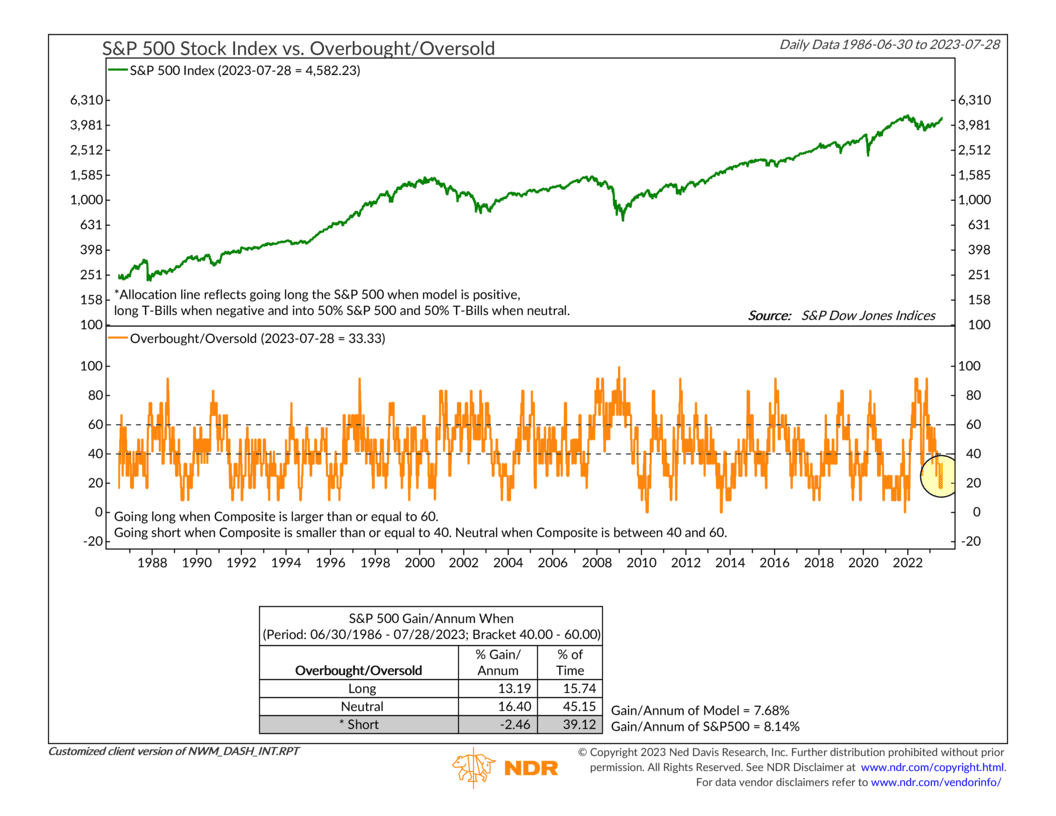
All this intense price action lately has led to a majority of the indicators in the composite pointing to an overbought market. This is a warning that, at least in the short term, prices might have run up too quickly—so we shouldn’t be surprised to see a little price weakness going forward.
The bottom line, however, is that in the intermediate- to longer-term, the technicals are suggesting that the stock market has a lot of bullish intent at this time.
This is intended for informational purposes only and should not be used as the primary basis for an investment decision. Consult an advisor for your personal situation.
Indices mentioned are unmanaged, do not incur fees, and cannot be invested into directly.
Past performance does not guarantee future results.
The post The Dow’s Bullish Scent first appeared on NelsonCorp.com.