OVERVIEW
The U.S. stock market rose 4.02 percent last week on a shortened week of trading due to the Fourth of July holiday.
The most significant gains came from growth stocks, up 4.81 percent last week.
Emerging market stocks did well, rising 3.42 percent. And developed country stocks, although lagging the other major indices, still gained 1.38 percent.
It was a “risk-on” type of week, as both investment-grade and high yield bonds had positive returns, while safe-haven assets like long-term Treasuries declined over one percent.
Real estate did particularly well, gaining about 5.21 percent.
Commodities were up mostly across the board, as gold rose 0.54 percent, oil was up 5.08 percent, and corn prices increased 7.6 percent for the week.
The VIX index settled below 30, a sign that implied volatility in the stock market continues to drop.
And finally, the U.S. dollar fell 0.27 percent for the week.
KEY CONSIDERATIONS
The Comeback Kid – When the stock market sold off in March, we saw a break in the S&P 500’s trend that was concerning. (In this analysis, we measure the trend as the 3-month average price of the index relative to its 12-month average price).
After that sharp downturn, we needed to see the trend reassert itself, or else a prolonged slump in the stock market could become more likely.
As the graph below shows, the stock market did indeed reassert itself after the March lows, and the 3-month average price of the S&P 500 index (the green shaded area) bottomed out in May. Since then, it has rallied nicely against the index’s 12-month average price (the orange shaded area).
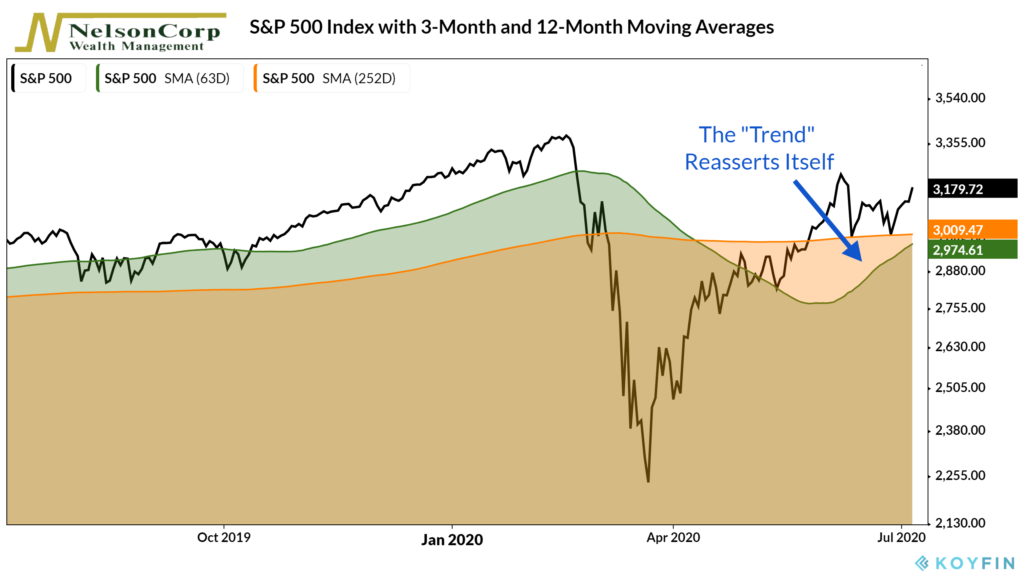
It didn’t have to turn out that way. In the last recession, the trend started breaking down near the beginning of 2008, and the 3-month average price of the S&P 500 didn’t bottom out and start improving relative to the 12-month average price until late April 2009.
That is why the trend is so important. And that is why we pay close attention to it when it tries to tell us something.
Of course, measuring the trend is not perfect, and this particular method is just as fallible as any other indicator.
However, when we combine it with a collection of various types of indicators, it helps us take the temperature of the stock market, so to speak. It gives us a sense of the overall health of the market.
Currently, the consensus from our indicators is mostly positive for stocks unless momentum starts to wobble from here.
Manufacturing Sets Off Fireworks – The ISM Manufacturing Index showed a strong rebound in June, rising 9.5 points, its largest increase since 1980.
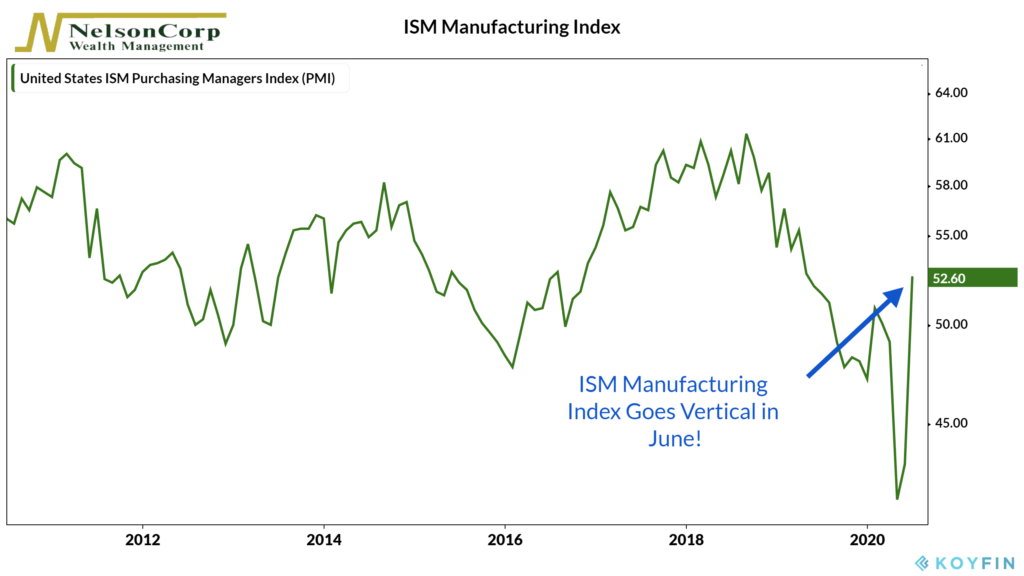
This is good news for the economy and the stock market as it indicates that factory activity is back on a growth trajectory after getting slammed during the COVID shutdown.
The labor market also continued down its path to recovery, adding another 4.8 million workers in June after an increase of about 3.2 million the prior month.
However, given there were more than 21 million jobs lost in March and April combined, the road to a full recovery in the labor market may still have many more months to go.
This is intended for informational purposes only and should not be used as the primary basis for an investment decision. Consult an advisor for your personal situation.
Indices mentioned are unmanaged, do not incur fees, and cannot be invested into directly.
Past performance does not guarantee future results.
The post The Comeback Kid first appeared on NelsonCorp.com.