OVERVIEW
Last week was a shortened holiday trading week, and the main U.S. stock indexes did well. The S&P 500 went up by 1%, the Dow increased by 1.3%, and the Nasdaq saw a gain of 0.9%.
Even foreign stock markets experienced a boost, with developed country markets rising by 1% and emerging markets by 0.4%.
In the bond market, the 10-year Treasury note’s yield climbed to around 4.47%, compared to the previous week’s 4.42%. Long-term Treasury bond prices dipped by about 0.23%, while intermediate-term Treasuries gained about 0.24%.
Commodities, on the other hand, took a slight hit, dropping by 0.5% overall. Corn was the main contributor to the decline, falling by 0.5%. Oil managed a small gain of around 0.1%, and gold saw a more substantial increase of 0.94%. Real estate experienced a positive trend, rising by 0.8%. Meanwhile, the U.S. dollar weakened by approximately 0.3%.
KEY CONSIDERATIONS
Talking Turkey – Here’s a fun little market fact: the S&P 500 Index has ended Thanksgiving week in the green three-quarters of the time going back to 1961. More so, going back to 1952, the Dow Jones Industrial Average tends to gain an average of 0.54% in the Wednesday preceding and the Friday following Thanksgiving Day.
In other words, Turkey Day is bullish for stocks.
But the stock market didn’t wait until Thanksgiving week to stuff itself with gains. Go back a few weeks, and we see that the S&P 500 just had its best 3-week rally since the first half of 2020.
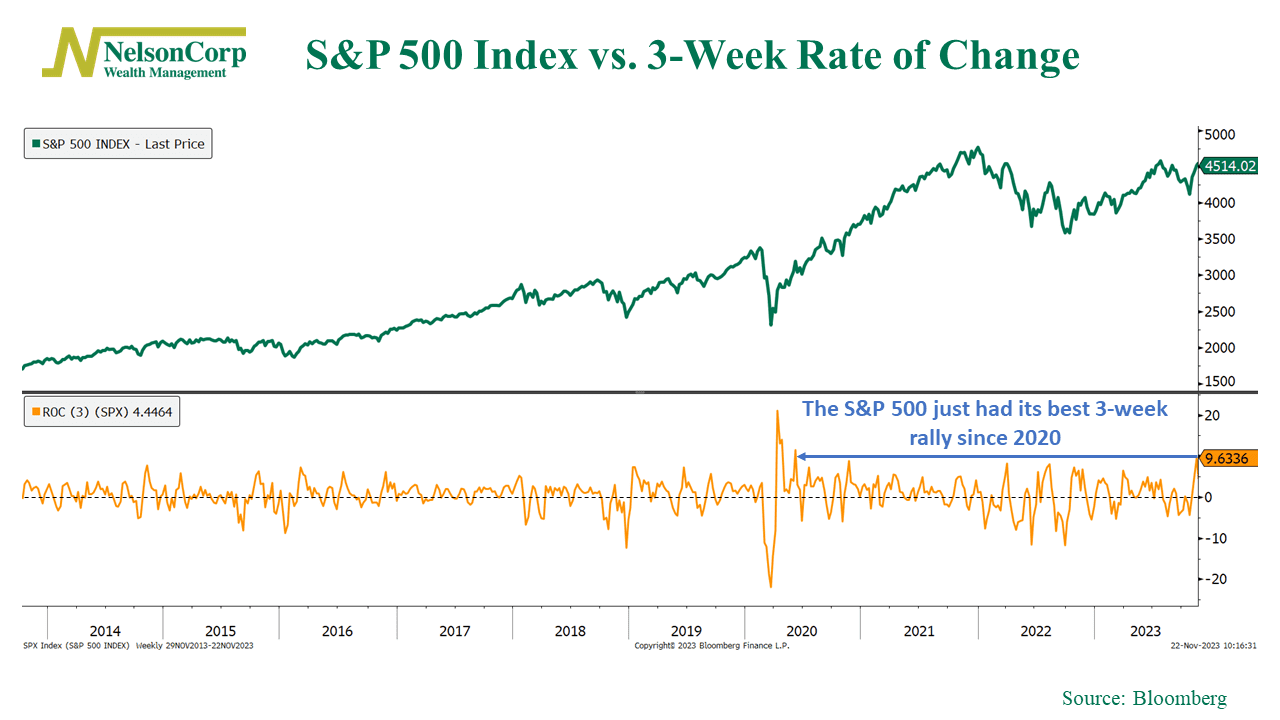
That feels bullish. But can it be sustained?
Here’s one reason why it could be. The chart below shows that the S&P 500 Equal Weight Index just closed above a measure of its long-term trend—its 200-day moving average—for the first time since September.
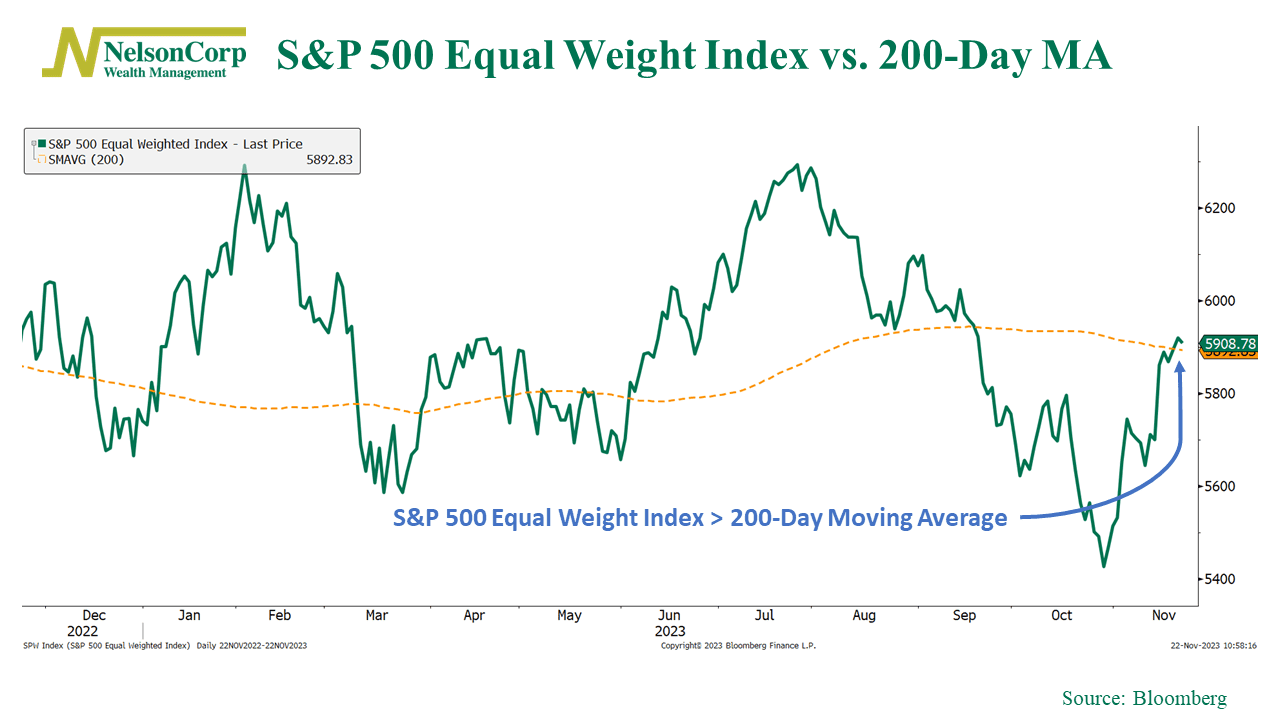
This is significant because the S&P 500 Equal Weight Index places an equal weight on all the stocks in the index, as opposed to the market-cap-weighted methodology of the traditional S&P 500 Index.
In other words, it more accurately measures how the average stock in the stock market is doing. This is important because much of the stock market’s return this year has come from just a few large stocks. The fact that the average stock is finally starting to participate in the rally is a good sign.
There are some areas of concern, though. All this bullish price action has resulted in a surge in the level of optimism among investors. While usually a good thing, when it gets excessive, it can be bad because the extreme nature of the optimism turns into a headwind for stocks.
For example, our Investor Behavior Model, shown below, just dropped to a net reading of zero, its lowest reading on record.
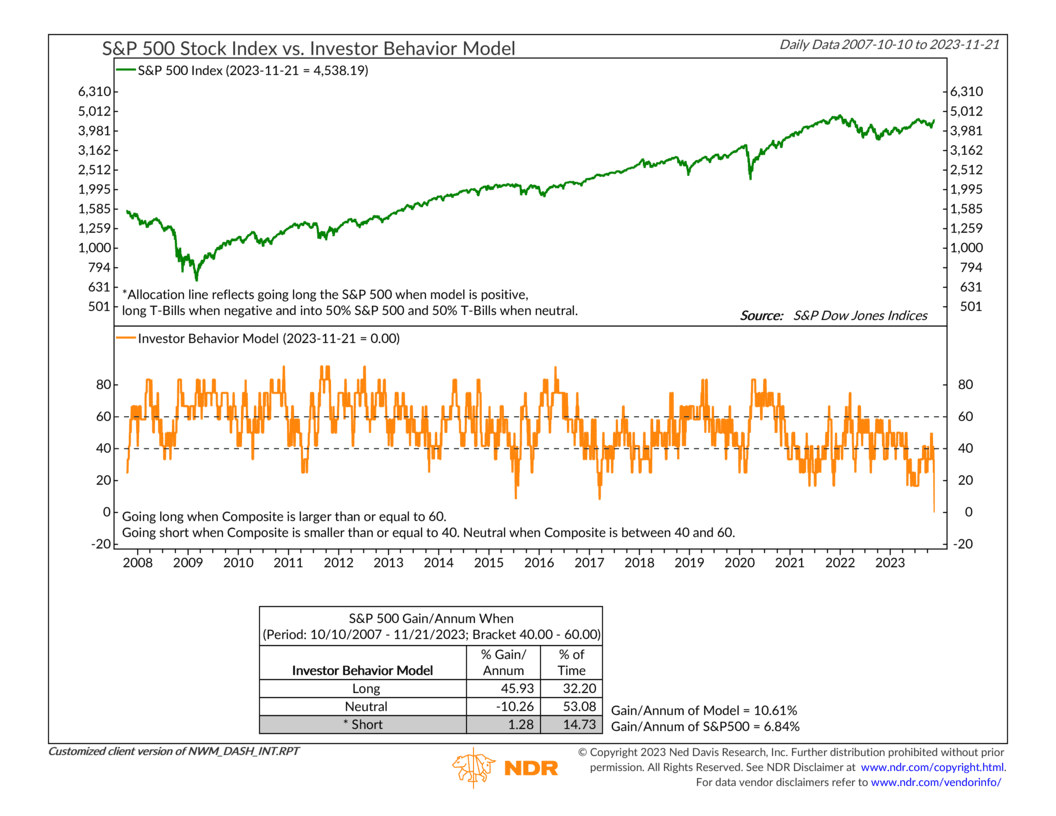
This is essentially telling us that investors are way too optimistic about the current rally, valuations aren’t favorable, volatility indicators are bearish, and the market looks overbought in the short- to intermediate term.
While all this isn’t enough to tilt the overall weight of the evidence away from the positive price-action message, it does temper that bullish outlook somewhat.
To end on a good note, though, the economy remains strong, so our overall outlook will likely continue to lean to the positive side of things as long as the market’s price action holds up.
This is intended for informational purposes only and should not be used as the primary basis for an investment decision. Consult an advisor for your personal situation.
Indices mentioned are unmanaged, do not incur fees, and cannot be invested into directly.
Past performance does not guarantee future results.
The S&P 500 Index, or Standard & Poor’s 500 Index, is a market-capitalization-weighted index of 500 leading publicly traded companies in the U.S.
The post Talking Turkey first appeared on NelsonCorp.com.