OVERVIEW
Last week marked the fifth consecutive winning streak for major U.S. stock indices, with 14 out of the past 15 weeks ending positively. The S&P 500 saw a 1.4% increase, while the Dow experienced a modest gain of just 0.04%, and the Nasdaq surged by 2.3%.
Small-cap and growth stocks emerged as the week’s top performers, each rising by approximately 2.5%. Conversely, value stocks saw a more modest increase of just 0.1%.
Emerging markets experienced a strong week with a 2.5% increase, while developed country stocks saw a smaller gain of 0.2%. Concurrently, the U.S. dollar strengthened by approximately 0.2%.
Bond markets faced challenges, with the 10-year Treasury rate rising to 4.17% from the previous week’s 4.02%, resulting in an overall 0.85% decline for the bond market.
Real estate performance remained relatively stagnant, while commodities recorded broad gains of nearly 2%, primarily attributed to a significant increase in oil prices of over 6%. Gold, however, experienced a slight decline of about 0.6%.
KEY CONSIDERATIONS
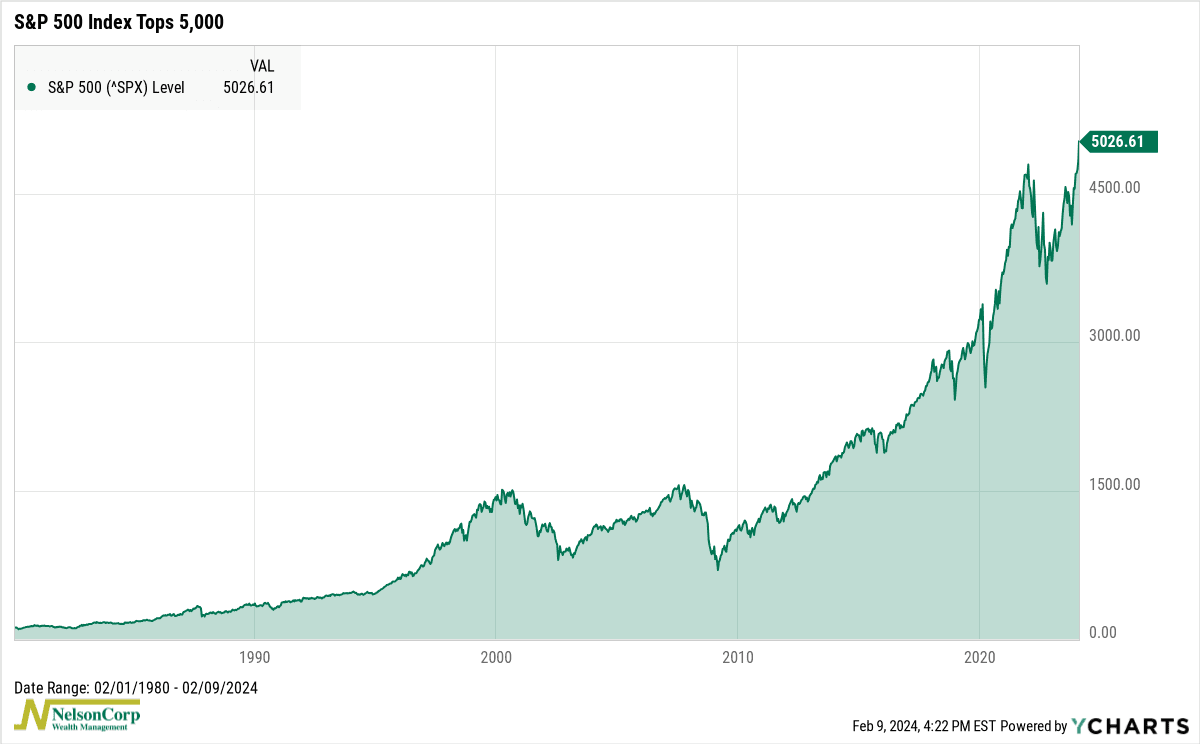
Take It Slow – It was another positive week for U.S. stocks. The S&P 500 Index finally closed above the 5,000 mark, its highest close ever.
Improved stock market breadth has helped a lot. Although there’s been a lot of talk about how just a handful of big stocks are driving the rally, we actually see a decent amount of participation happening under the surface.
For example, the chart below shows that the percentage of U.S. stocks trading above their long-term trend (200-day moving average) is currently about 68%. That’s well above the low of 27% last October.
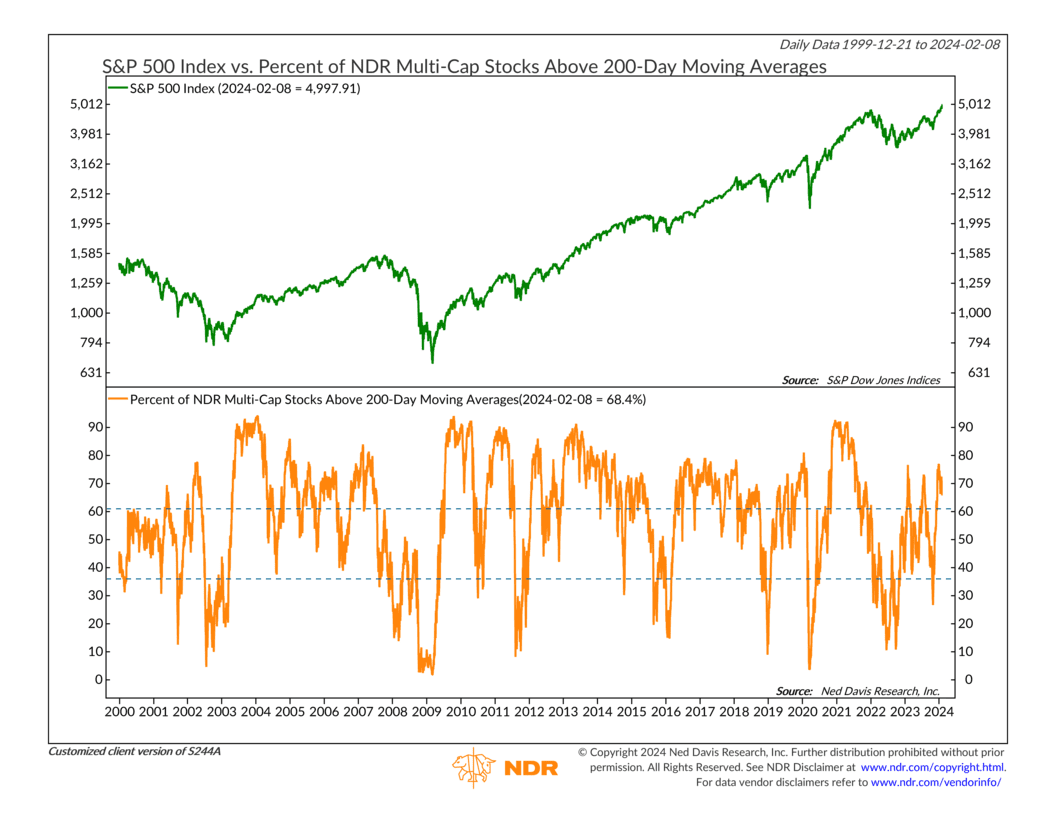
We think this could help sustain the rally going forward. As the saying goes, the more the merrier!
However, I will note that this specific measure of breadth has rolled over to start the year—meaning fewer stocks are participating in the rally than when we started the year—so that will be something to keep an eye on.
As for other factors impacting markets right now, the Federal Reserve is—as usual—a big one. Over the past few days, there’s been a shift in expectations for what the Fed’s plan is. The new outlook on Wall Street is that the Fed will probably not cut interest rates at its upcoming meeting in March.
At first glance, this might seem like it would be bearish for the stock market. However, as this next chart shows, a slower pace of rate cuts has historically been more bullish for the stock market.
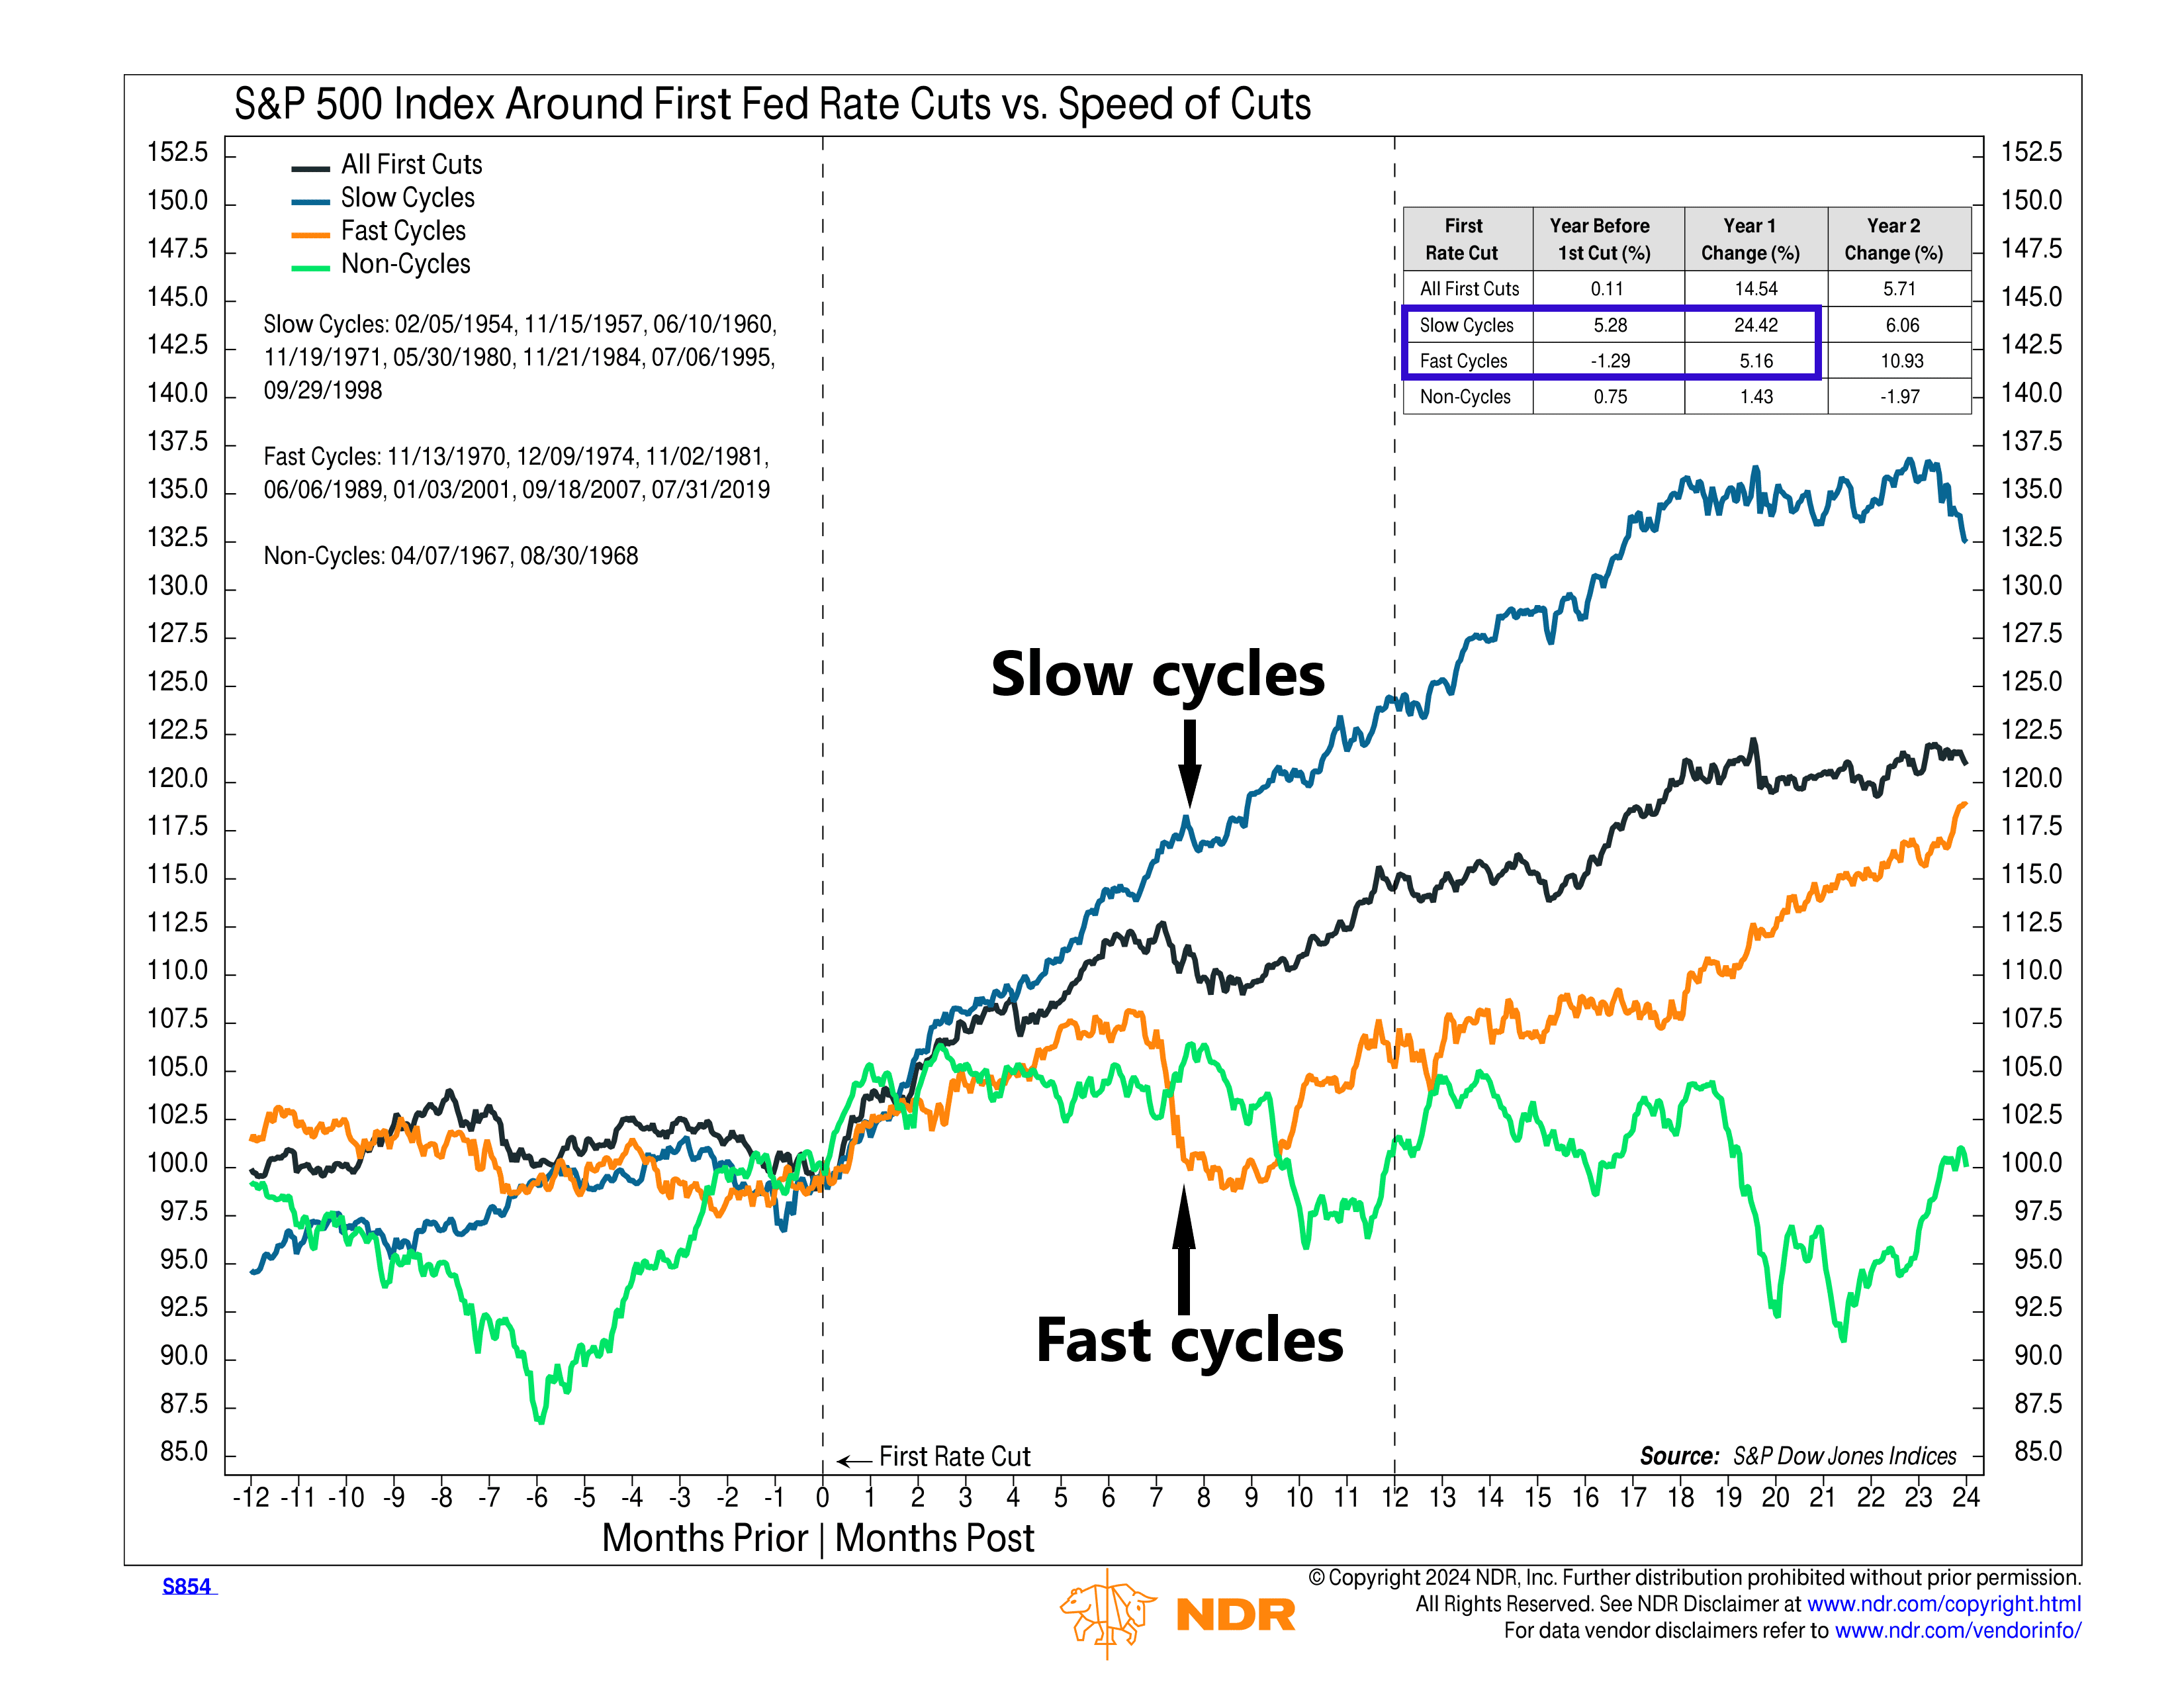
During fast rate-cut cycles (defined as five or more cuts over a 12-month period), the S&P 500 Index has risen just 5.2%, on average, with a lot of volatility during the first year. In contrast, a slow rate-cut cycle (5 or fewer cuts) has been associated with S&P 500 gains of 24.4%, with much less volatility.
In other words, the bottom line is that when it comes to cutting interest rates, it’s much better for the stock market if the Fed moves slowly.
This is intended for informational purposes only and should not be used as the primary basis for an investment decision. Consult an advisor for your personal situation.
Indices mentioned are unmanaged, do not incur fees, and cannot be invested into directly.
Past performance does not guarantee future results.
The S&P 500 Index, or Standard & Poor’s 500 Index, is a market-capitalization-weighted index of 500 leading publicly traded companies in the U.S.
The post Take It Slow first appeared on NelsonCorp.com.