OVERVIEW
Last week was generally positive for the U.S. stock market. The S&P 500 saw a solid 1.84% increase, while the Dow had a more modest rise of 0.34%. The Nasdaq outperformed, surging over 3%. Growth stocks experienced a gain of about 3.5%, but value stocks dropped by around 0.3%. Small caps also saw a slight dip of approximately 0.06%.
Turning to foreign stocks, it was a mixed bag. Developed country stocks gained 0.87%, but emerging markets fell by 0.58%.
In the bond market, Treasury yields remained mostly stable, with the 10-year settling at 4.14%. Intermediate-term Treasuries increased by about 0.65%, and long-term Treasuries gained about 0.18%. Investment-grade bonds performed well, rising approximately 1.3% for the week.
Real estate had a positive week, with a 0.53% increase. However, commodities experienced a decline of around 0.68%. Oil dropped by 1.5%, corn fell nearly 3%, while gold saw a rise of about 1.05%. The U.S. dollar strengthened by about 0.15%.
KEY CONSIDERATIONS
Supporting Cast – The U.S. stock market hit a new all-time high the Friday before last, and then it made four more consecutive new highs last week. That was impressive. There’s a good chance the S&P 500 will likely break 5000 soon.
For some perspective, the chart below shows that the S&P 500 first closed above 50 in 1958 and then passed 500 in 1995. Now it’s close to 5000.
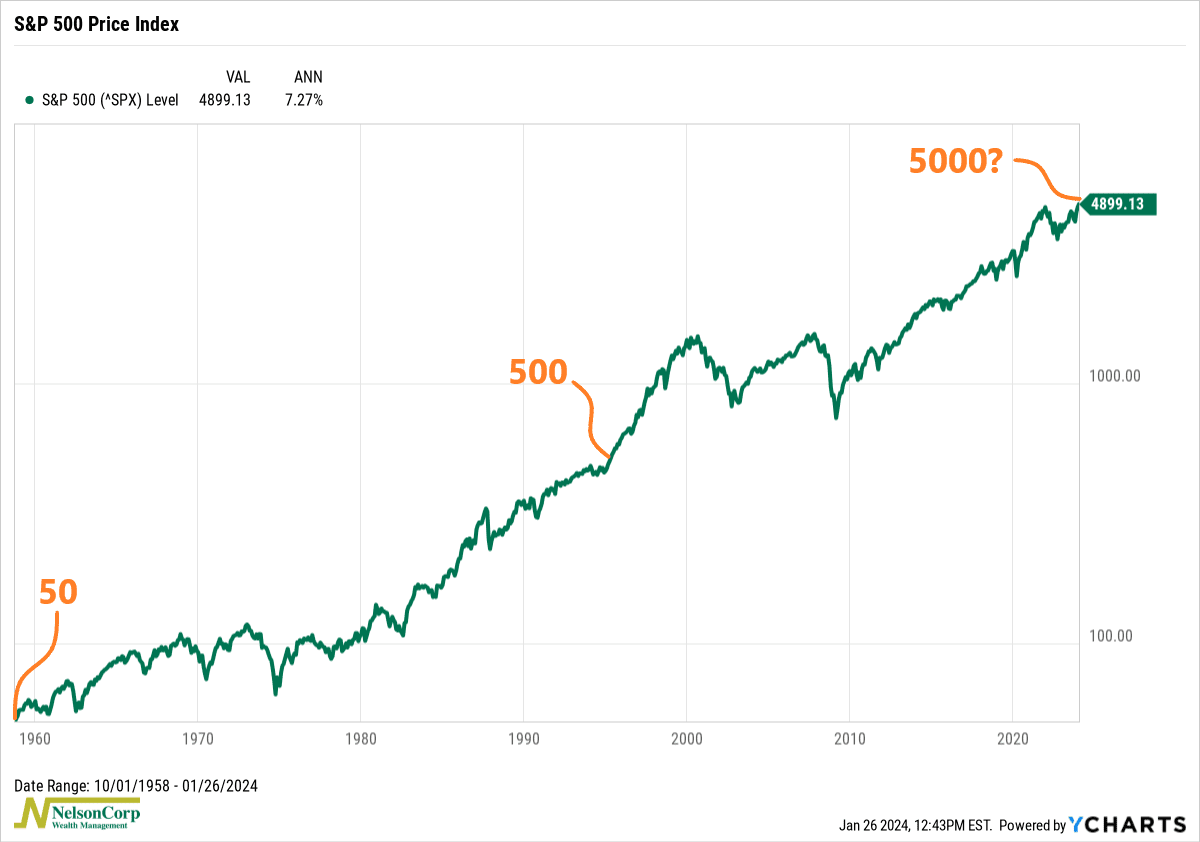
That’s a 100-fold increase in 65 years—a roughly 7.3% annualized return. Not bad. And guess what? That doesn’t include dividends. Throw those in there, and you can tack on a few more percentage points to that annualized return.
So, the stock market does a good job of compounding wealth over the long run. But here’s the catch. Not everyone has 65+ years to wait for their wealth to compound. It’s more like 40 years of saving and investing, and then you retire and must live off your nest egg. Plus, there’s the psychological pain that comes with enduring stock market volatility.
In other words, life gets in the way.
That’s where risk management comes in. Our process, called Risk Aware Investing, measures market risk and uses it to prepare a portfolio for the current market environment rather than the long-run average. We believe this is a superior process for helping clients reach their retirement goals than the traditional “hold-and-hope” method.
To do this, we focus on and measure a wide array of financial indicators. The price movement of the stock market itself is obviously a big factor, but we’ve also found that the so-called “supporting cast” indicators are crucial to the success of the overall process. The idea is that these indicators will help support or confirm what the overall market is doing.
For example, the chart below shows the Dow Jones Industrial Average (the Dow) on the top clip and the Dow Jones Transportation Average on the bottom. The idea here is that we like to see the transportation average “confirm” what the Dow is saying and vice versa.
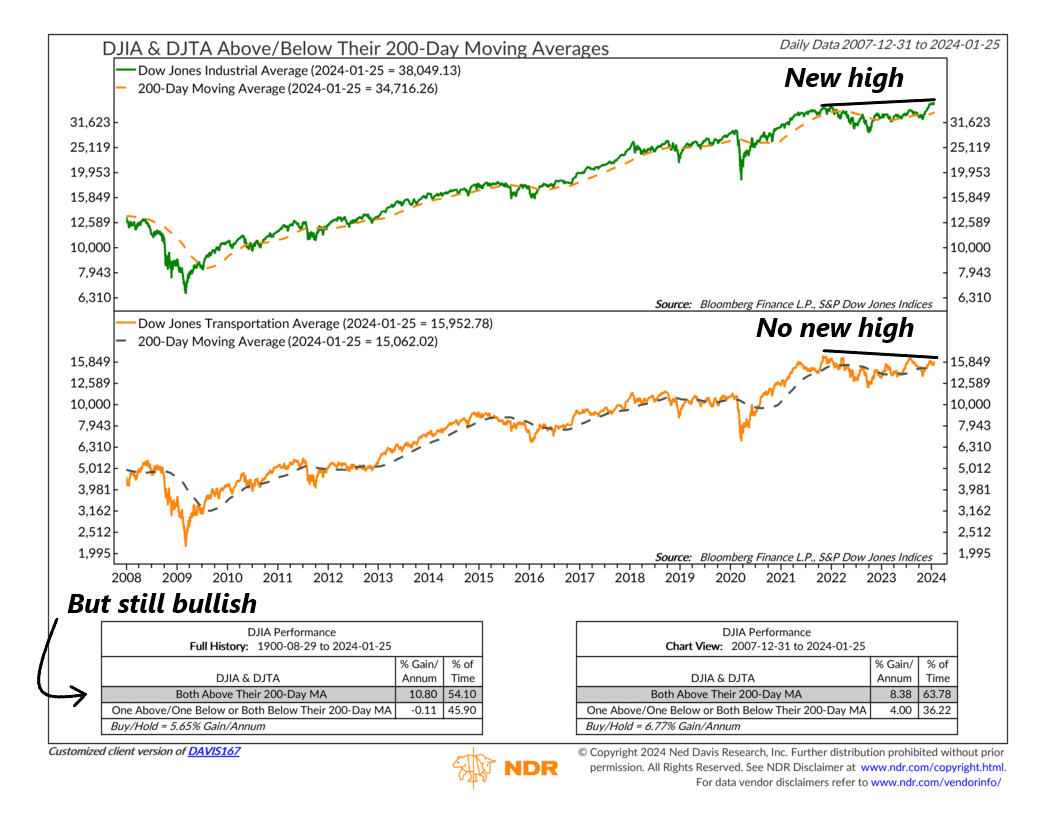
As you can see, the Dow itself has broken out to new all-time highs, whereas the transportation average has yet to be confirmed. However, both averages are trading above their average 200-day price, and that has historically been a bullish scenario for the overall stock market.
Another example involves looking at sectors within the stock market. In this case, we focus on the seven cyclical sectors that comprise the S&P 500. The indicator below finds that when more than 65% of the cyclical sectors are above their 50-day relative strength moving average, the S&P 500 has performed the best.
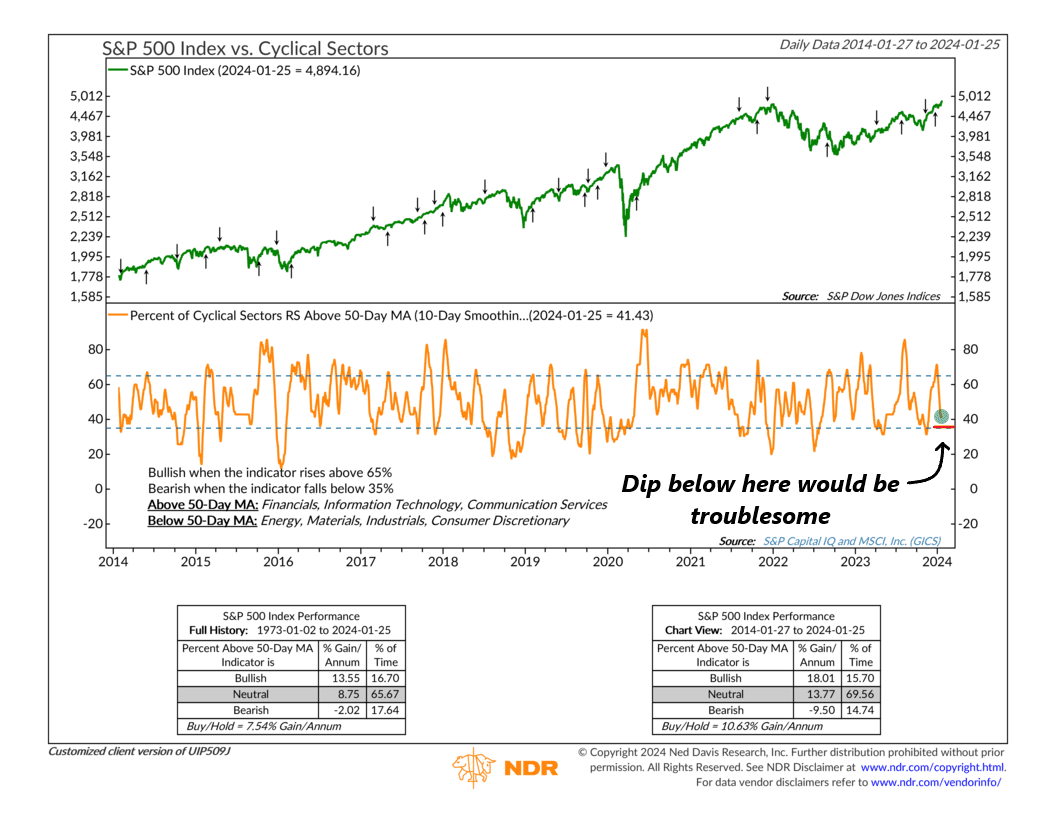
While this was the case at the start of the year, the number has dropped from five sectors down to three. Only Financial, Technology, and Communication Services are still in intermediate-term relative strength uptrends. This is still a positive place to be return-wise, but if one more sector drops out, it could spell trouble for the overall market.
So, that’s just a couple of examples of what we call supporting cast indicators. I only focused on price-based ones today, but we also measure sentiment, valuation, and even economic-based versions to determine whether the overall market trend is being supported.
A lot of the time, the message from these indicators is mixed. But overall, the weight of the evidence usually leans in one direction or the other.
Right now, that continues to be on the positive side. For the most part, the supporting cast indicators are affirming what the star of the show—the stock market at all-time highs—is doing. But if that changes, our process will enable us to adapt and readjust accordingly.
This is intended for informational purposes only and should not be used as the primary basis for an investment decision. Consult an advisor for your personal situation.
Indices mentioned are unmanaged, do not incur fees, and cannot be invested into directly.
Past performance does not guarantee future results.
The S&P 500 Index, or Standard & Poor’s 500 Index, is a market-capitalization-weighted index of 500 leading publicly traded companies in the U.S.
The Dow Jones Industrial Average (DJIA) is a price-weighted index composed of 30 widely traded blue-chip U.S. common stocks. The Dow Jones Transportation Average™ is a 20-stock, price-weighted index that represents the stock performance of large, well-known U.S. companies within the transportation industry.
The post Supporting Cast first appeared on NelsonCorp.com.