OVERVIEW
The major U.S. stock indexes traded slightly lower last week. The S&P 500 fell 0.4%, the Dow slipped about 0.1%, and the Nasdaq dropped 1.3%. Small-cap stocks, however, managed to outdo their larger-cap buddies and posted a positive gain of over 1% for the week.
The rest of the world managed to remain positive as well. Developed country stock markets rose about 0.8%, and emerging markets gained roughly 1.1%.
On the other hand, bonds traded lower as the yield on the benchmark 10-year yield rose to 4.28% from 4.17% the week before. Only short-duration Treasuries managed to eke out a small gain, while the overall bond market fell about 0.5%.
Despite a volatile week, real estate ended the week pretty much where it started. Most commodities, however, traded lower—except for oil, which rose over 2%. Gold fell about 0.6%, wheat dropped 6.5%, and corn dipped 1.6%. On the currency front, the U.S. dollar strengthened about 0.4%.
KEY CONSIDERATIONS
Strong and Persistent – After a hotter-than-expected inflation report last Tuesday, which sent the S&P 500 Index down nearly 1.4% in a day, the stock market managed to claw its way back to essentially where it started the week—above 5,000.
It still closed slightly lower for the week (bummer). But if we zoom out, we can see how strong and persistent the stock market rally has been over the past few months. As the chart below shows, the S&P 500 had been up 14 out of the past 15 weeks going into last week. That hadn’t happened since 1972!
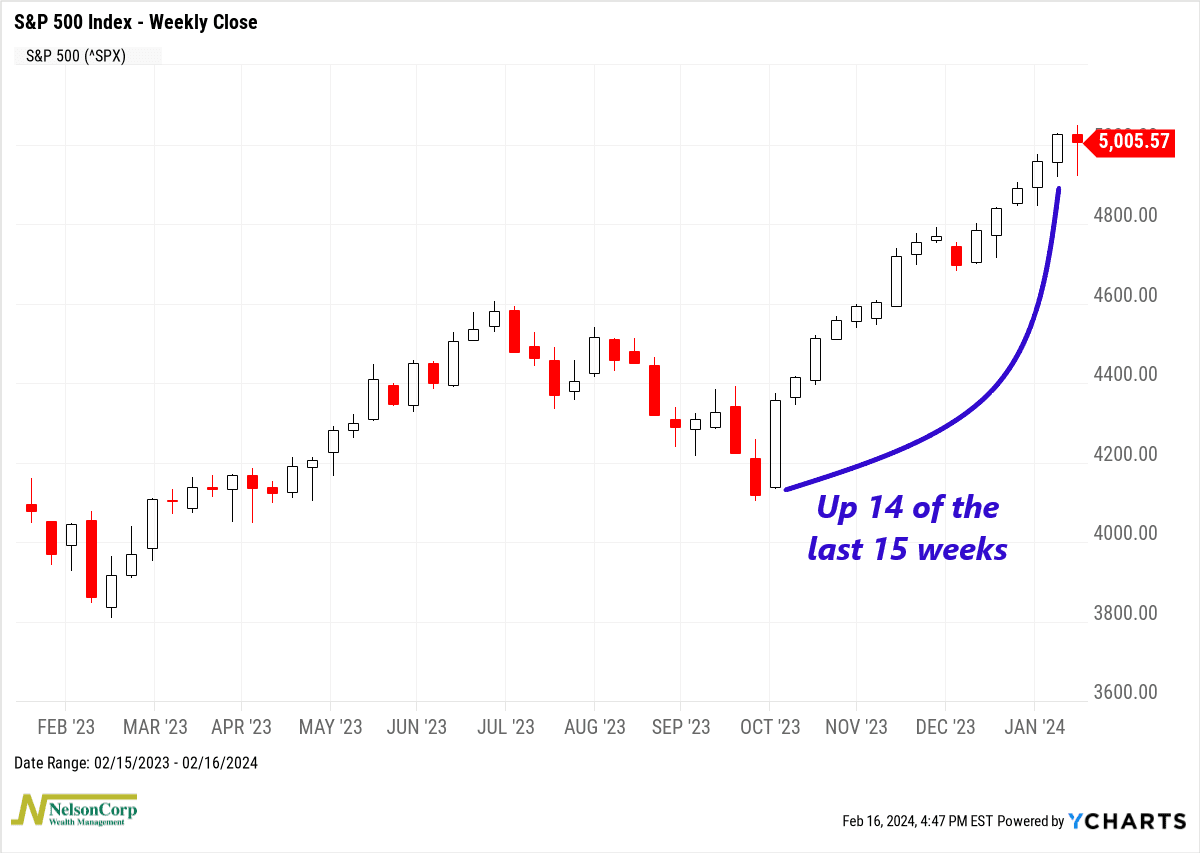
In other words, the market was due for some sort of pullback. But the fact that last week’s pullback was relatively mild and short-lived reinforces this idea on Wall Street that bull markets ignore bad news and use any good news as a reason to keep climbing.
Indeed, we are in a bull market, and we’ve continued to see more and more stock market indexes hit new all-time highs this year as a result.
As this next chart shows, on Monday, the NYSE Composite closed at an all-time high for the first time since January 12, 2022.
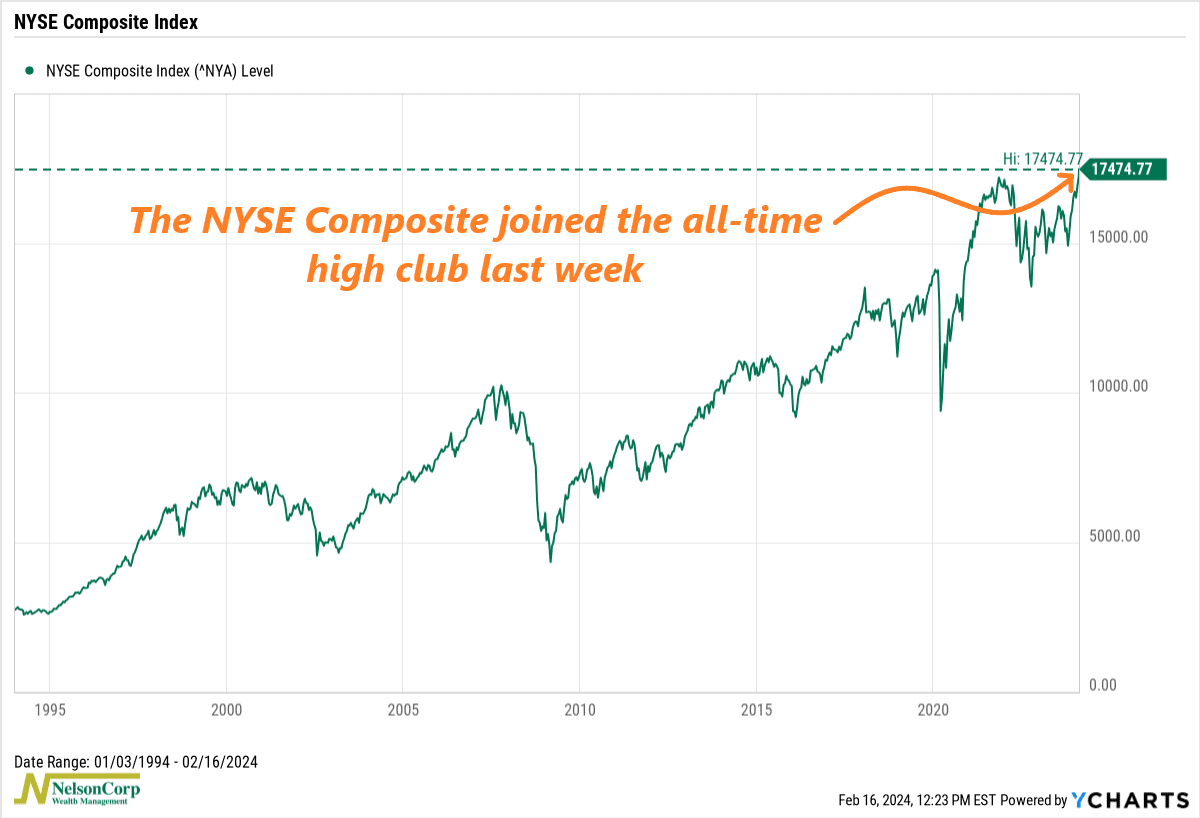
This is significant because this index contains over 2,000 stocks, providing a much broader representation of “the stock market” compared to popular benchmarks like the Dow, S&P 500, or Nasdaq 100. So, chalk that up as another important (and even broader) stock market index joining the all-time high club.
However, it’s important to proceed with caution. There’s another Wall Street saying that “the public is often right during the trends, but wrong at both ends.”
In other words, it usually makes sense to ride the wave of a strong market trend but be wary when it becomes overly optimistic or pessimistic.
For example, this next chart shows the put/call ratio, a popular measure of investor sentiment. The put/call ratio compares the number of option “bets” that the market will go down (puts) to the number betting it will go up (calls), helping to show if investors are feeling bullish or bearish about the market. A high ratio suggests extreme pessimism (good), while a low ratio suggests extreme optimism (bad).
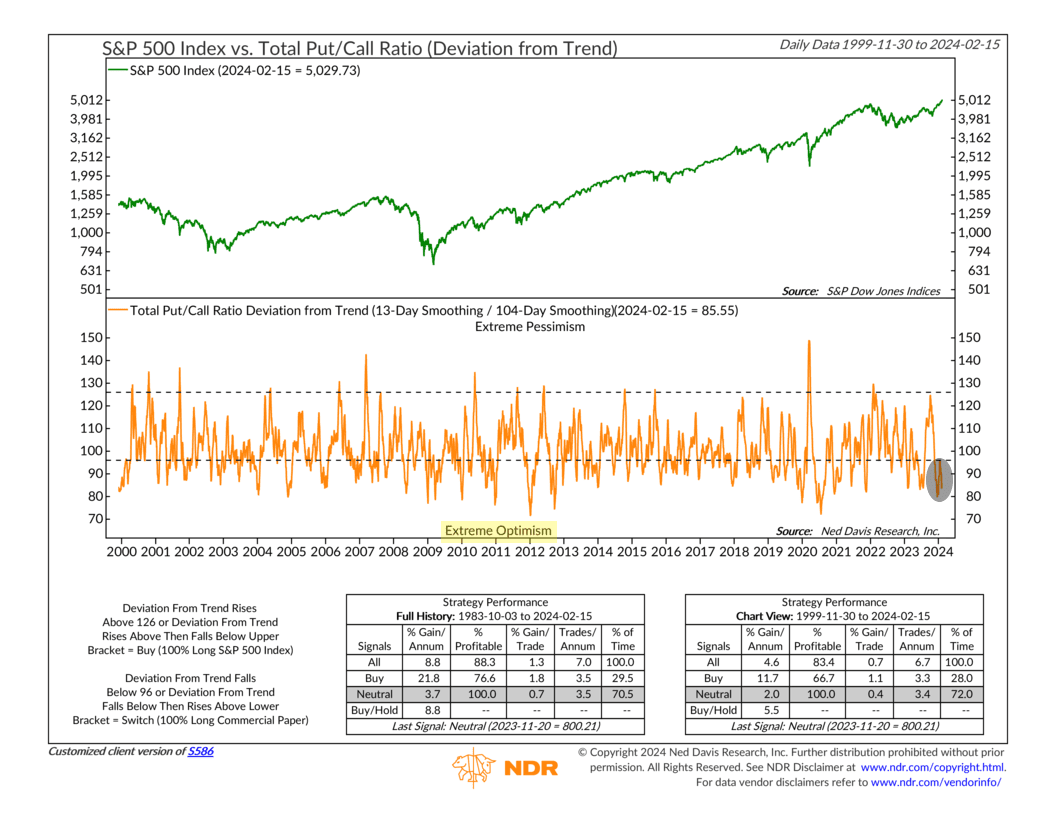
As you can see highlighted on the chart, it’s currently very low, signaling extreme optimism among market investors. That’s usually bad for stocks, as investors tend to get it wrong at extremes.
We think this will be something important to watch going forward. For now, the market remains strong and persistent. But we’ll keep an eye on indicators of investor sentiment for any sign of potential trouble ahead.
This is intended for informational purposes only and should not be used as the primary basis for an investment decision. Consult an advisor for your personal situation.
Indices mentioned are unmanaged, do not incur fees, and cannot be invested into directly.
Past performance does not guarantee future results.
The S&P 500 Index, or Standard & Poor’s 500 Index, is a market-capitalization-weighted index of 500 leading publicly traded companies in the U.S.
The NYSE Composite Index is a float-adjusted market-capitalization weighted index which includes all common stocks listed on the NYSE, including ADRs, REITs and tracking stocks and listings of foreign companies.
The post Strong and Persistent first appeared on NelsonCorp.com.