OVERVIEW
After a flattish week, the U.S. stock market concluded on a positive note with a pretty nice surge on Friday. The S&P 500 Index experienced a gain of 1.3%, the Dow Jones Industrial Average saw a rise of 0.7%, and the Nasdaq showed a significant increase of 2.4%. In contrast, the Russell 2000 Index, reflecting small-cap stocks, notably lagged, recording a decline of over 3% for the week.
Although foreign stock markets also had a strong outing on Friday, they remained in negative territory for the week. Developed country markets fell about 0.3%, and emerging markets dropped roughly 0.9%.
It was a mixed week for bond prices. The benchmark 10-year Treasury yield rose to about 4.62%, slightly up from last week’s close of 4.5%. Intermediate-term Treasuries fell about 0.5%, and short-term Treasuries fell around 0.3%. Longer-dated (20+ years) Treasuries, however, edged higher by about 0.3% for the week.
The U.S. dollar strengthened about 0.75%, which helped broadly push commodity prices down over 2.5%. Specifically, oil dropped 4%, gold fell 2.8%, and corn was down about 0.3%. Real estate also had a rough week, down about 2.5%.
KEY CONSIDERATIONS
Staying Afloat – The U.S. stock market followed up the previous week’s strength with a flat to slightly higher performance last week.
Although it snapped its eight-day winning streak on Thursday, a strong outing on Friday kept the S&P 500 Index in positive territory for the week. In fact, the index managed to closer higher than its early-October high of 4377, creating what we call a “higher high.”
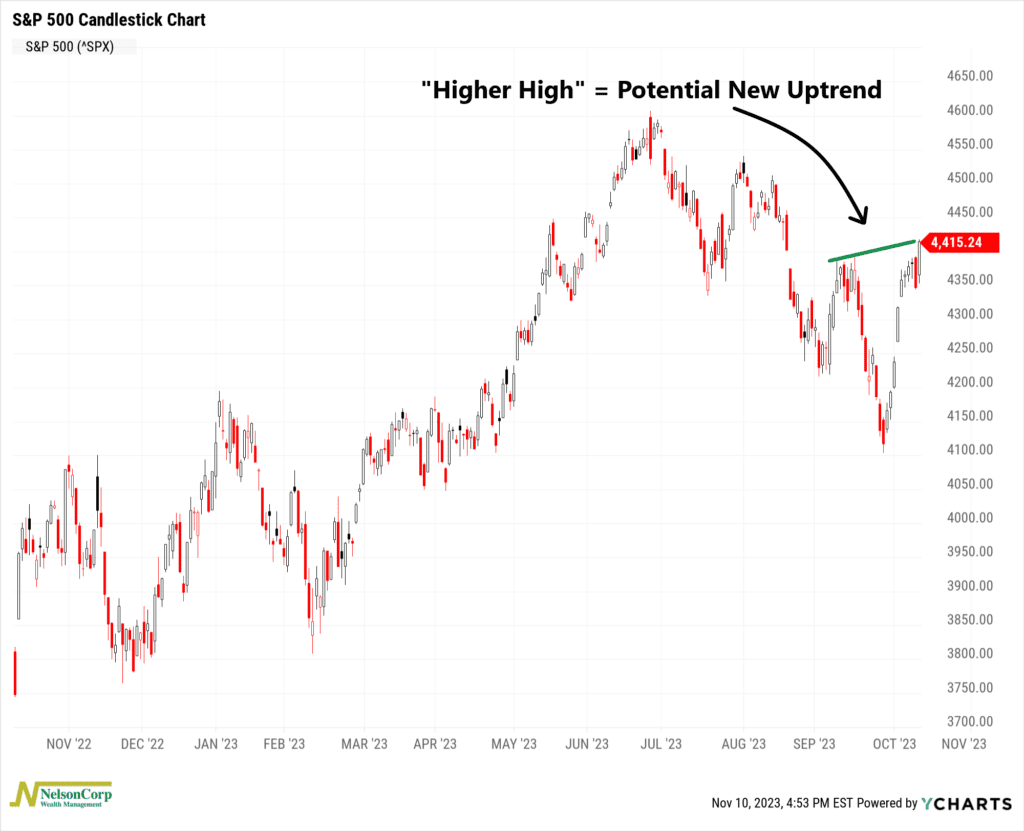
This is a positive development from a technical perspective, as the simplest definition of an uptrend is a series of higher highs and higher lows. With a higher high technically in place, the next thing we’d like to see is a higher low, ideally above the 200-day moving average.
The 200-day moving average is a key metric to watch because it can be thought of as the water line for the stock market. If the S&P 500 is trading above its 200-day moving average (its average price over the past 200 days), it’s a sign that the market is swimming above water. In other words, it’s gaining ground or trending higher relative to its past. But if it’s trading below its 200-day moving average, it’s as if the market is sinking below water—trending downwards.
The chart below illustrates this nicely. In 2021, the S&P 500 Index (green line) was above its 200-day moving average (the blue-shaded area) all year. And sure enough, returns were strong that year. In 2022, however, the S&P 500 spent the majority of the year below water, and returns were dreadful that year.
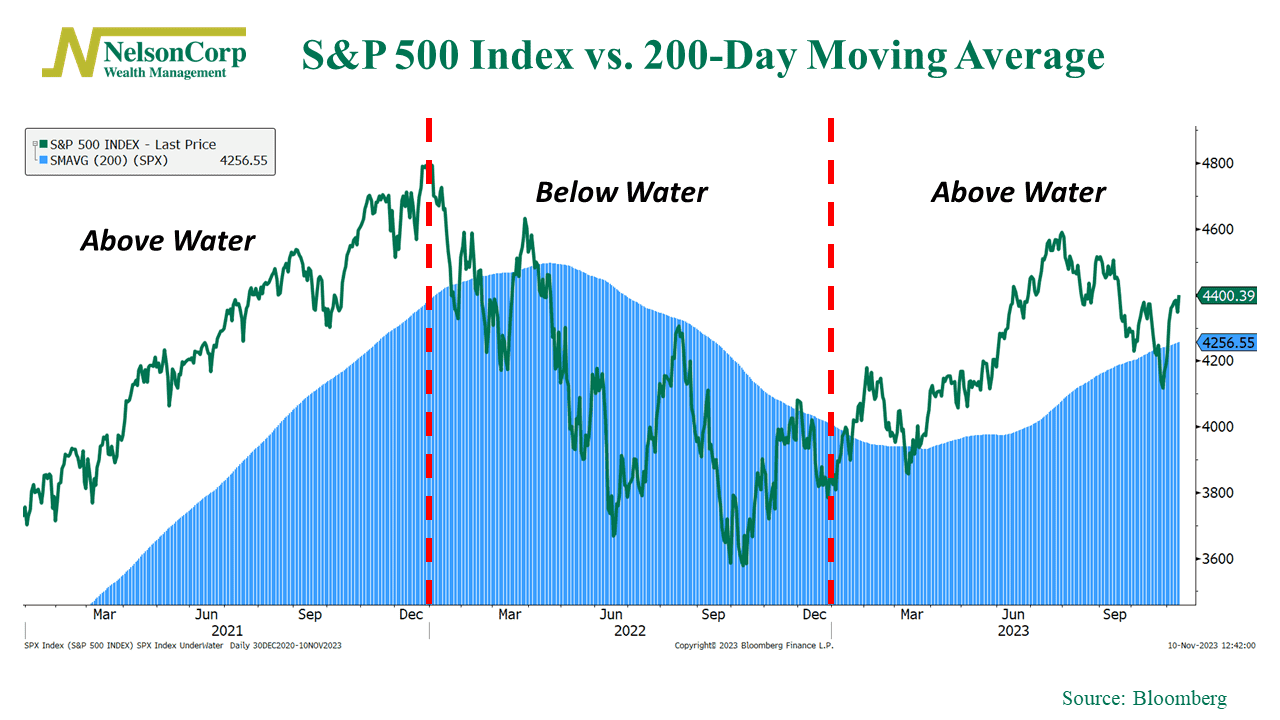
The good news? The S&P 500 has mostly traded above water in 2023. We’ve had a few dips below the 200-day moving average, but even the most recent decline lasted less than two weeks.
Indeed, our price-based modeling confirms the point. Our Price Movement model, shown below, bumped into its lower negative bracket twice in the past couple of months, but each time it bounced higher without going negative.
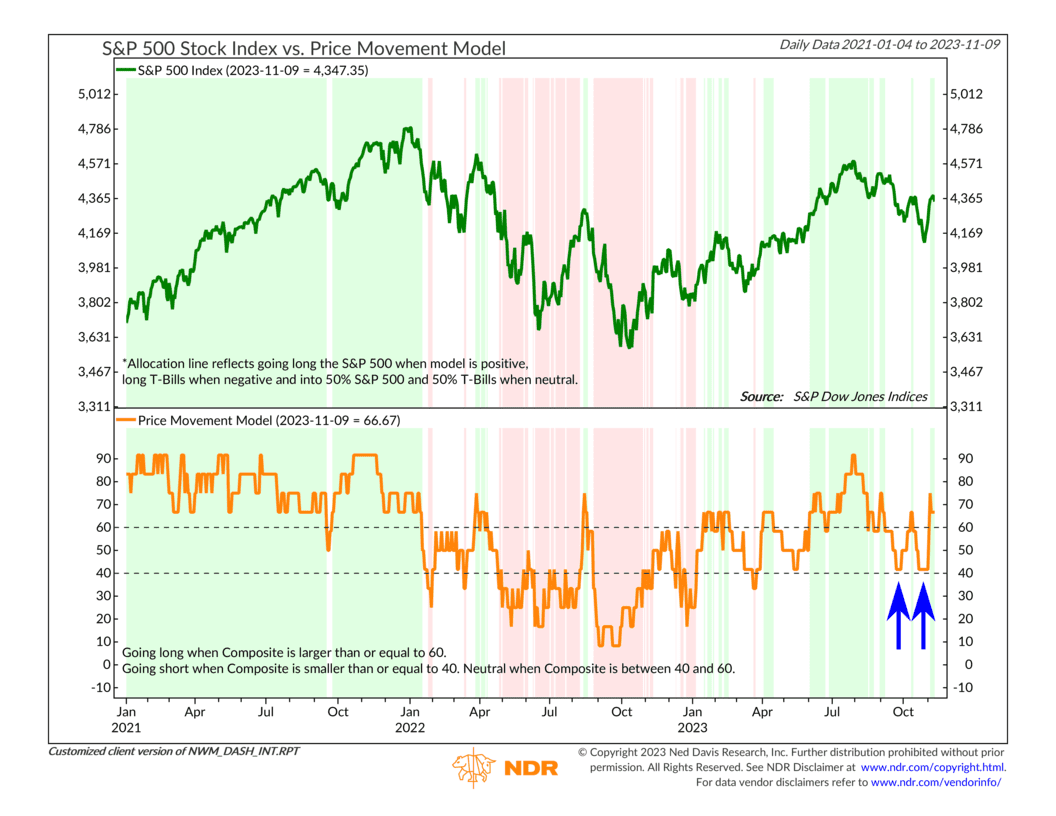
This is an encouraging development, as it means the underlying indicators are managing to stay afloat after getting knocked down.
The bottom line? As long as the market stays above water for the rest of the year and the weight of the evidence holds up, the stock market should have a good chance of ending the year on a positive note.
This is intended for informational purposes only and should not be used as the primary basis for an investment decision. Consult an advisor for your personal situation.
Indices mentioned are unmanaged, do not incur fees, and cannot be invested into directly.
Past performance does not guarantee future results.
The S&P 500 Index, or Standard & Poor’s 500 Index, is a market-capitalization-weighted index of 500 leading publicly traded companies in the U.S.
The post Staying Afloat first appeared on NelsonCorp.com.