OVERVIEW
The U.S. stock market closed higher last week with the S&P 500 jumping 2.6%. The Dow also rose 1.25%, and the Nasdaq surged 3.25%.
Foreign stocks did well, with developed country stocks and emerging markets both increasing about 2.7%.
Bonds were mostly flat for the week as the 10-year Treasury rate inched up to 3.77% from 3.74%. Intermediate-term Treasuries were essentially unchanged, and long-term Treasuries increased 0.42%. Corporate bonds were up moderately for the week, with corporate issues increasing 0.32%, and high-yield (junk) bonds increasing 0.41%.
Real estate rose around 1.48% last week. Commodities had a big week, surging 5.27% broadly. Oil rose 6.82%, corn swelled 9.06%, and gold inched higher by 0.13%. And finally, the U.S. dollar weakened by about 1.2%.
KEY CONSIDERATIONS
Slaying Inflation – Last week brought both positive and somewhat unfavorable news regarding inflation.
The latest Consumer Price Index (CPI) reading revealed that headline inflation, represented by the green line below, dropped to 4.05% in May compared to the previous year, marking the slowest rate in two years.
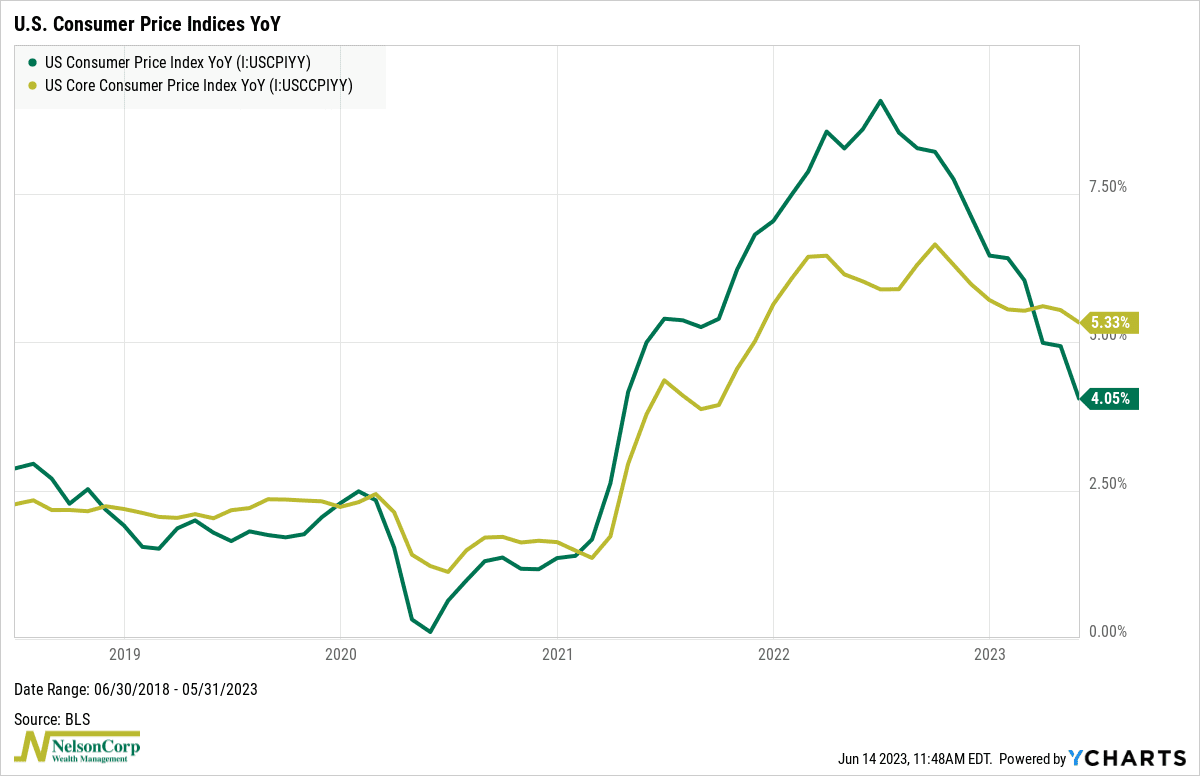
That’s the good news. The less-great news, however, is that the Core CPI (gold line)—which excludes volatile categories like food and energy—remains sticky. The Core CPI’s year-over-year increase was roughly 5.3% in May. In other words, as you can see on the graph, it’s falling but also kind of moving sideways, whereas the headline rate is clearly falling more quickly.
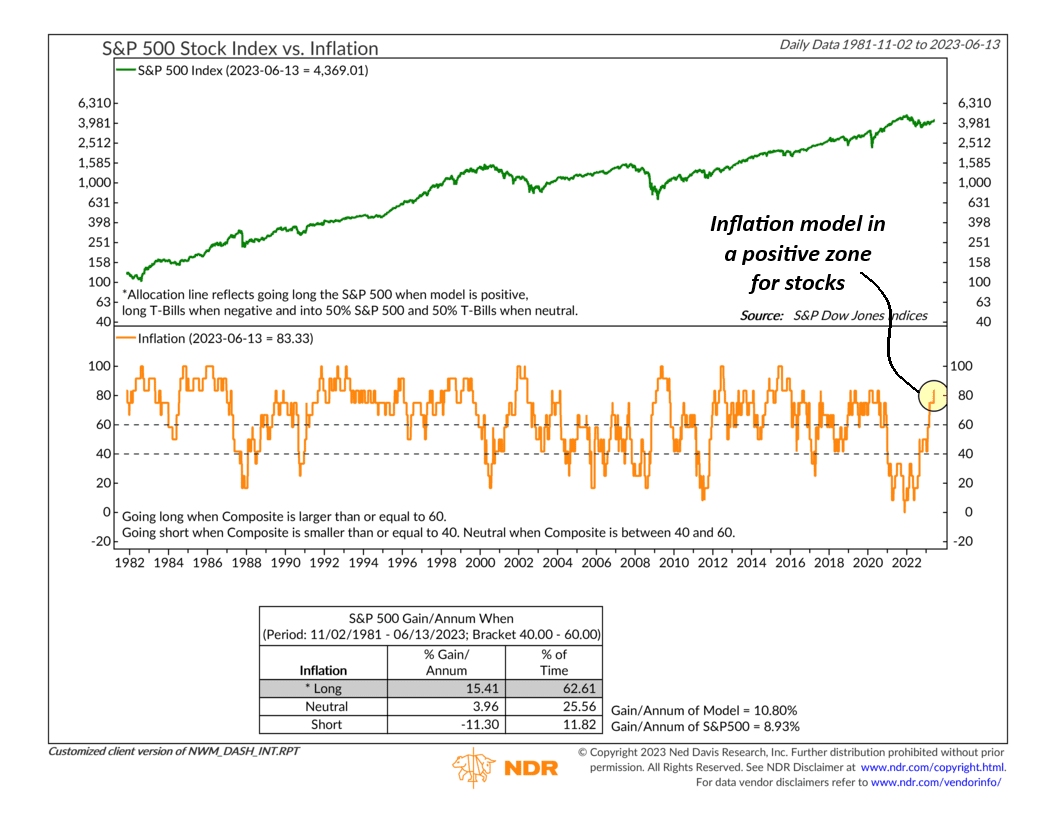
Nevertheless, as far as the stock market is concerned, our modeling suggests that the inflation dragon has been slain.
Our Inflation Model, shown below, has steadily improved over the past year. It rose into its positive zone earlier this year and improved even further with the recent CPI release.
The following indicator is one reason why. It compares the CPI’s annual rate of change with its 5-year average.
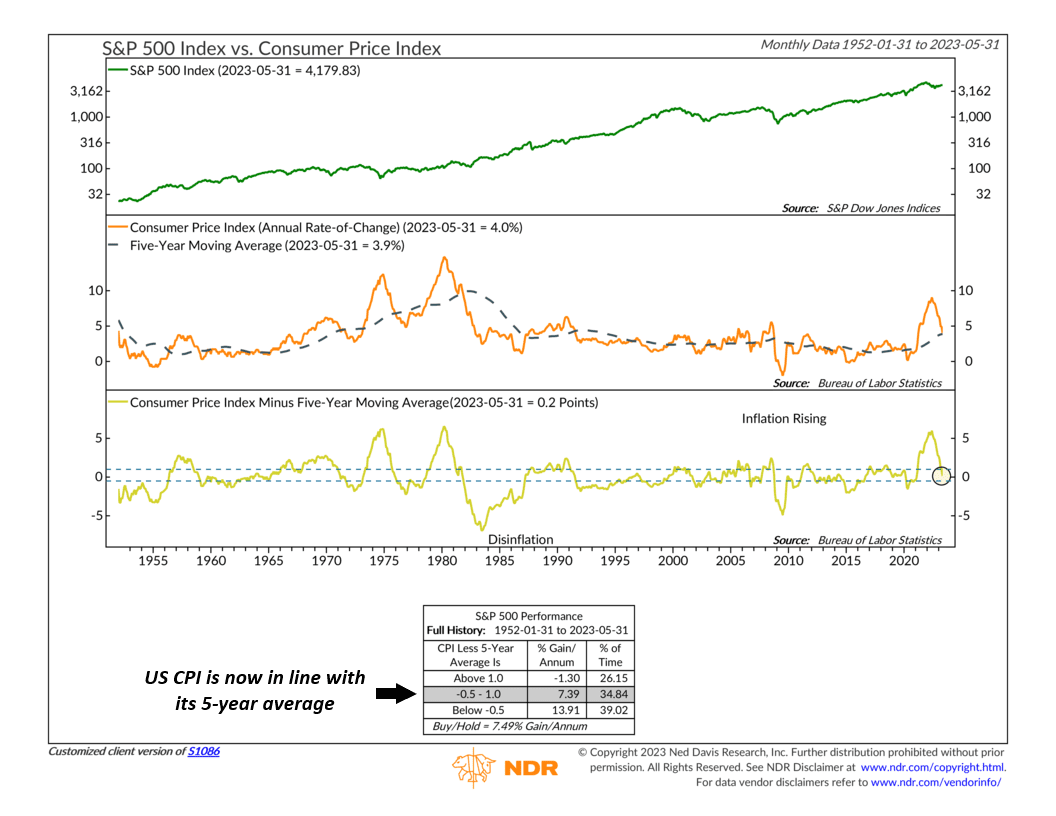
May’s CPI reading came in at 4%, meaning inflation is essentially running in line with its 5-year average. This improvement brought the indicator out of the negative zone it’s been in for over two years. And now that the indicator is in the neutral zone, the historical evidence suggests that stocks can increase at their long-term average rate going forward. Any further drop in the inflation rate could even bring the indicator into its positive zone, which would be even more bullish for the stock market.
The bottom line is we are observing concrete improvements in some of our external-facing indicators, particularly in relation to inflation. Last week, we pointed out that a significant portion of the current market rally is supported by price-focused indicators. Thus, witnessing positive economic-related data points is an encouraging sign that adds weight to the overall evidence.
This is intended for informational purposes only and should not be used as the primary basis for an investment decision. Consult an advisor for your personal situation.
Indices mentioned are unmanaged, do not incur fees, and cannot be invested into directly.
Past performance does not guarantee future results.
The post Slaying Inflation first appeared on NelsonCorp.com.