OVERVIEW
The U.S. stock market took another step higher last week, with all three major indices in the green. The Nasdaq rose 1.14%, the S&P 500 gained 1.85%, and the Dow led the pack with a solid 2.16% rise.
In terms of style, value stocks outperformed, rising 2.1% versus the 1.6% gain in growth stocks. Mid-caps did well, too, surging 2.22%, while small caps increased about 1.8%.
Looking overseas, emerging markets saw gains of about 1%, while developed markets performed even better with a 1.6% increase. Meanwhile, the U.S. dollar strengthened by about 0.3%.
Bonds had a relatively uneventful week, with the overall market rising just 0.05%. The largest gains were centered around longer-duration Treasuries, which rose about 0.4% for the week.
Real estate had a particularly strong showing, rising by 1.96%, while commodities also fared well, gaining about 1.4% broadly. Gold was the standout performer, boasting an impressive 3.66% increase, while oil saw a more modest rise of just 0.23%.
KEY CONSIDERATIONS
Seeking Higher Ground – It’s early, but so far, May is looking to be a lot better for the stock market than April was.
The S&P 500 Index has rallied in 6 of the past 7 days, and more importantly, it has overtaken its 50-day moving average, which it had previously been below for two straight weeks.
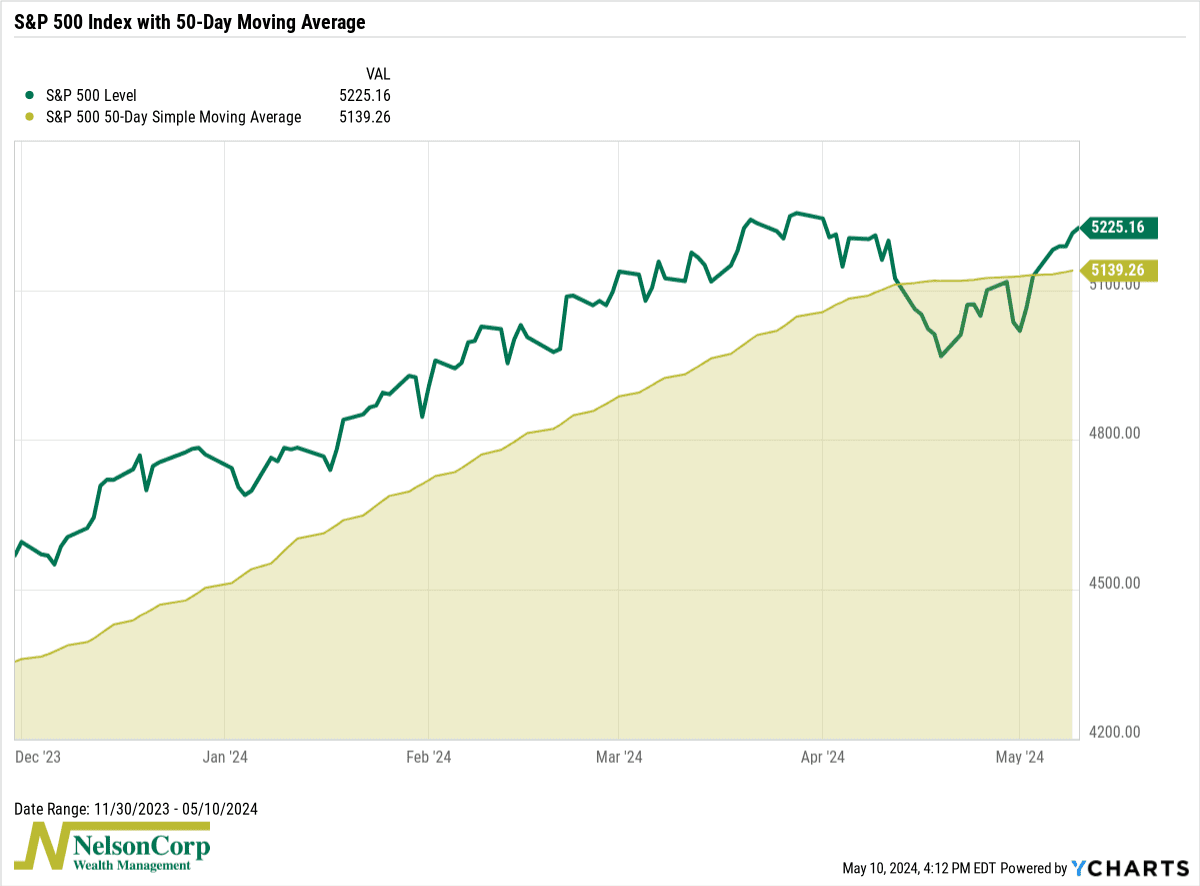
It certainly feels like the market wants to reach higher ground after a weak April. But if we zoom out just a little bit, we see that the market’s long-term trend is already there.
For example, the S&P 500’s 200-day moving average, shown below, is at all-time highs—and continues to move higher.
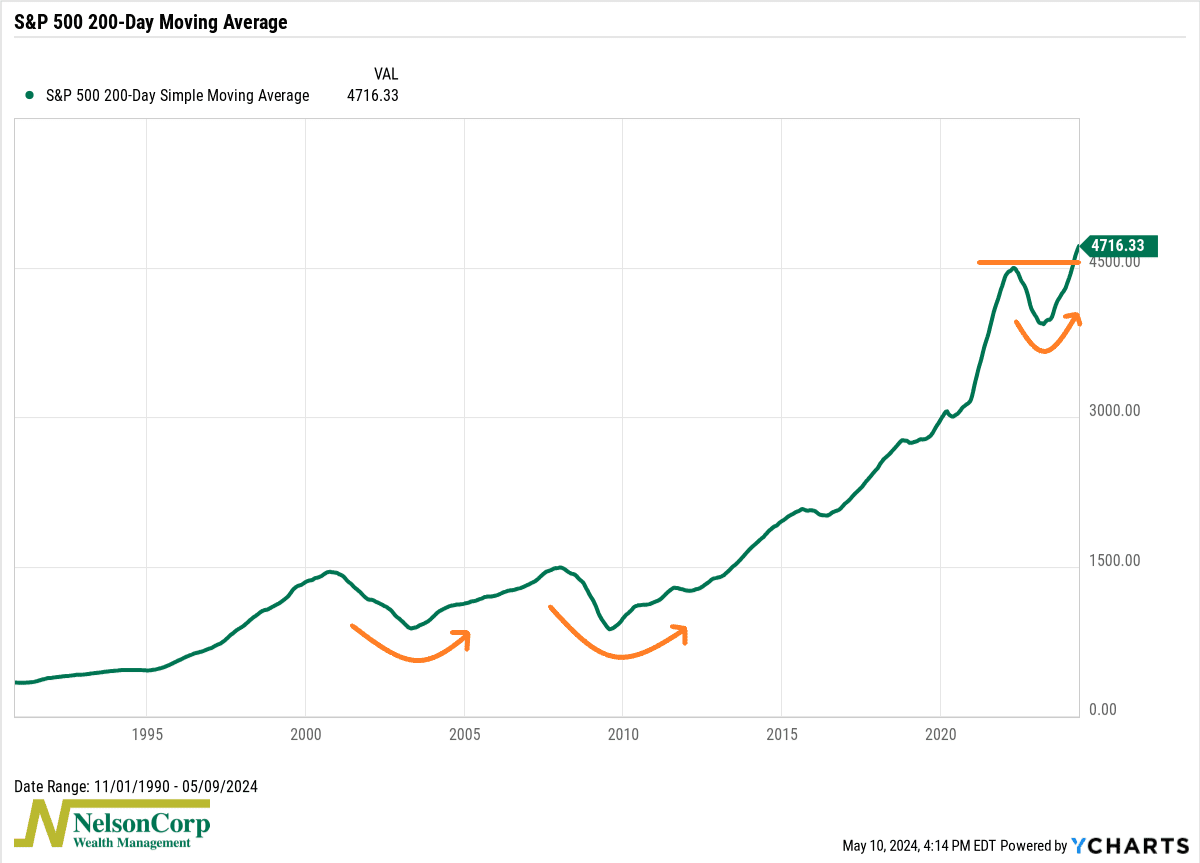
This is a simple yet powerful concept. Sure, stock prices can—and will—fluctuate quite a bit over shorter time frames, but if longer-term measures are holding up, there’s a good chance the overall market is pretty healthy.
So, what exactly has been driving the recent gains?
Well, a lot of it comes down to good old fundamentals or earnings. As the chart below shows, over the next 12 months, the market expects S&P 500 earnings to grow to about $253 per share, which is quite a bit higher than what was expected to start the year.
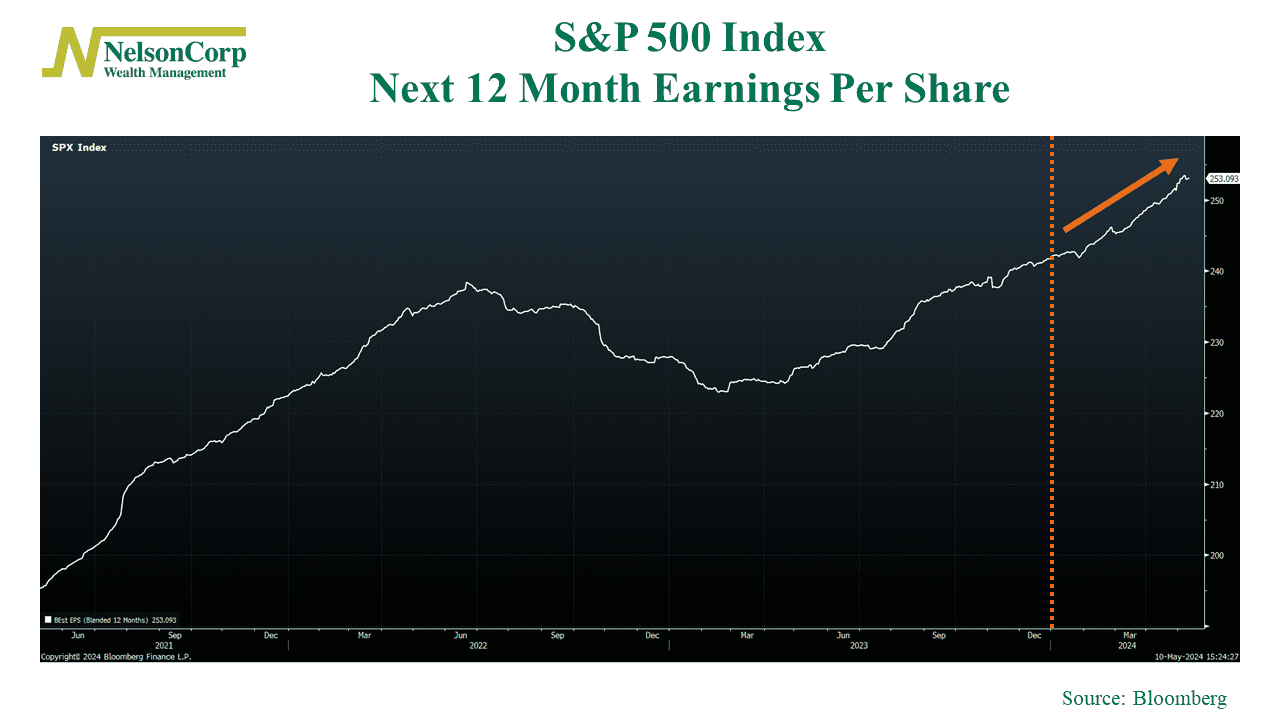
You can’t beat that. The stock market tends to follow profits, and if expectations are for record earnings in the coming year, then it’s pretty likely the market will keep moving higher.
As for our models, we continue to see the weight of the evidence lean bullish. This final chart shows the overall model reading of our primary stock market risk model, where a reading of 100% indicates max bullishness and a reading of 0% indicates max bearishness.
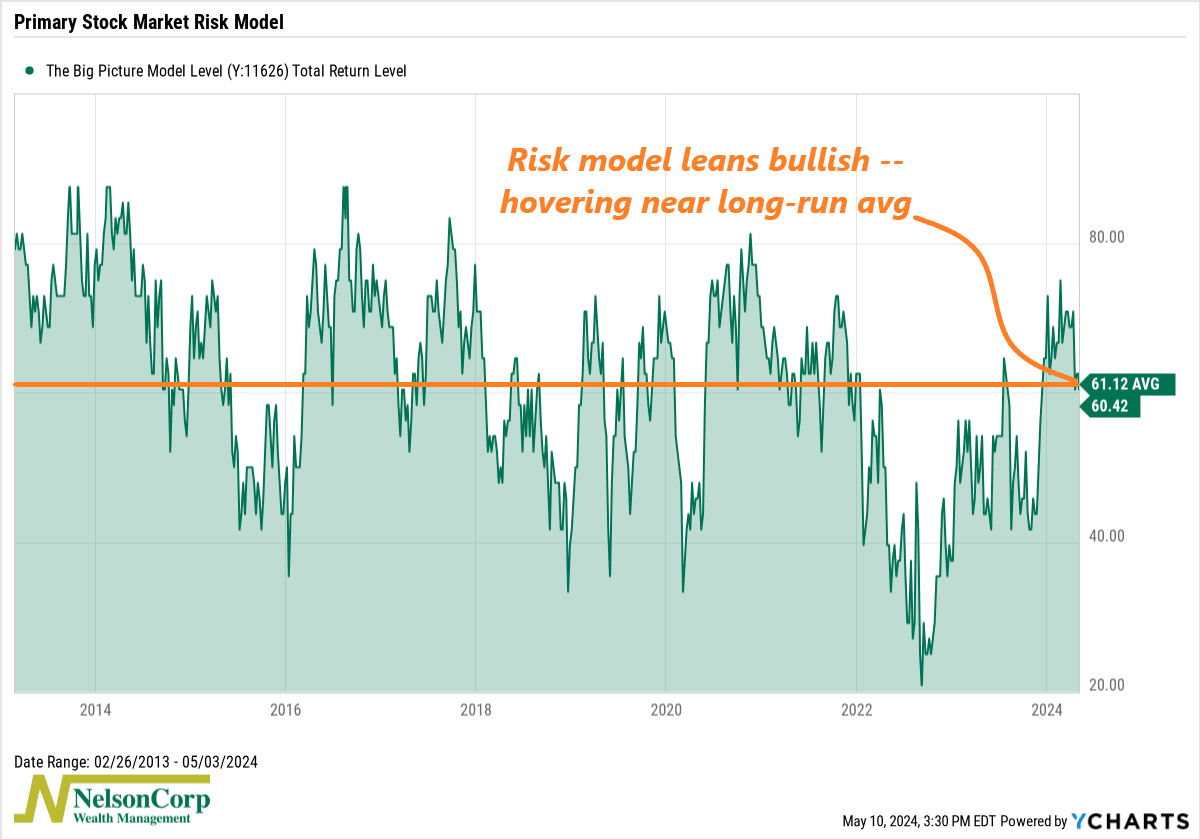
As you can see, at roughly 60%, the model’s reading is right in line with its long-run average reading over the past decade. Sure, we’ve seen it weaken from the mid-70% range reached earlier this year, but it would need to get down to around 50% before the model would call for an allocation change.
The bottom line? Most of the indicators we model point to a bullish market environment, and the market’s recent price action seems to agree.
This is intended for informational purposes only and should not be used as the primary basis for an investment decision. Consult an advisor for your personal situation.
Indices mentioned are unmanaged, do not incur fees, and cannot be invested into directly.
Past performance does not guarantee future results.
The S&P 500 Index, or Standard & Poor’s 500 Index, is a market-capitalization-weighted index of 500 leading publicly traded companies in the U.S.
The post Seeking Higher Ground first appeared on NelsonCorp.com.