OVERVIEW
Stocks continued to fall last week. In U.S. markets, the S&P 500 dropped 2.53%, the Dow declined 2.14%, and the Nasdaq shed 2.62%. Although foreign markets did better on a relative basis, developed countries still fell about 1.4%, and emerging markets declined about 0.3%.
The VIX Index, the so-called “fear gauge,” remained roughly flat at just over 21. This measure of implied stock market volatility has risen nearly 50% over the past three months, a sign that investors are getting increasingly nervous about the state of the stock market.
Bond yields backed off last week, resulting in a good week for bond prices. The 10-year Treasury yield fell to 4.84%, and the 2-year Treasury yield dropped to 5.04%.
Real assets, however, were down. Real estate registered a decline of roughly 1.6%, and commodities were down about 0.5% broadly. This was primarily due to a roughly 3% decline in oil and corn. Gold, though, rose over 1% to end the week. And finally, the U.S. dollar strengthened about 0.5% against the world’s major currencies.
KEY CONSIDERATIONS
Sagging Stocks – The leaves are falling, and so is the stock market.
Another onslaught of selling pushed the S&P 500 stock index decidedly below its 200-day moving average last week.
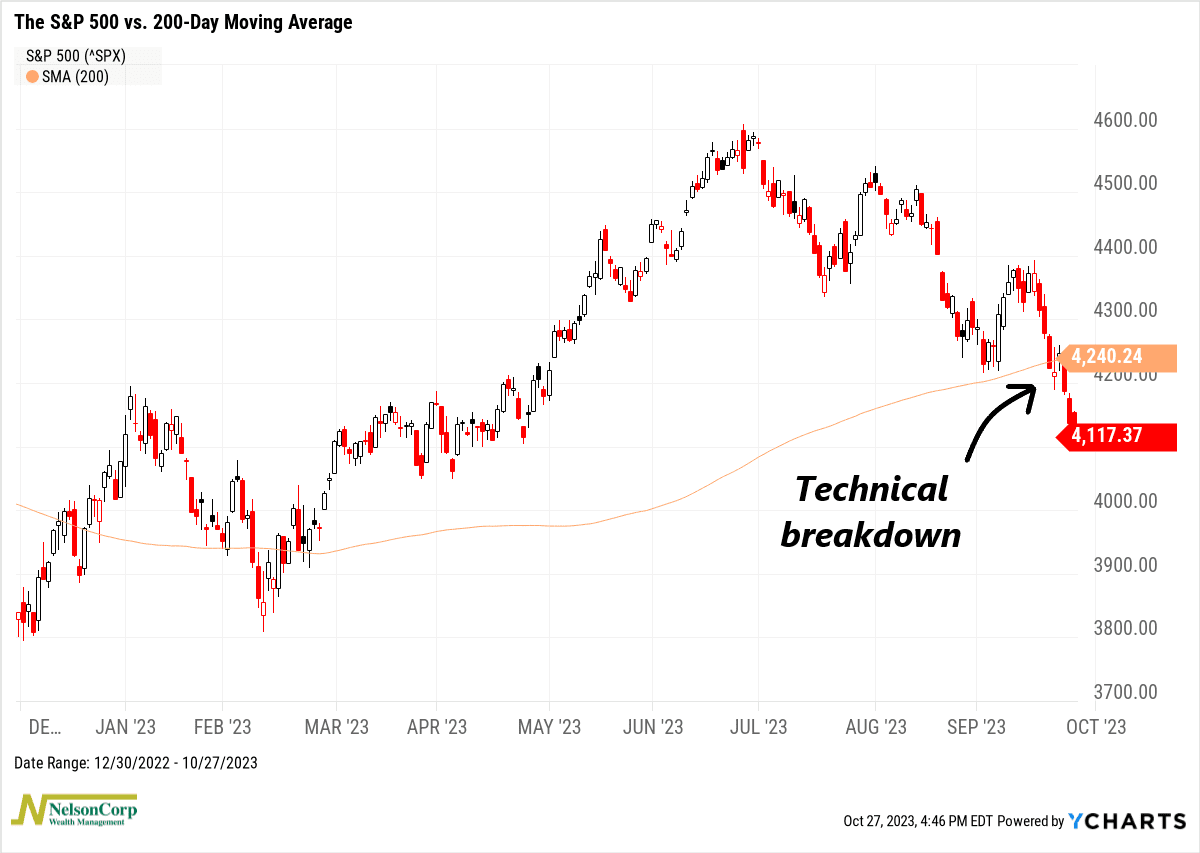
This is a major red flag because the 200-day moving average is a key technical level that represents the market’s longer-term trend; it’s kind of like a barometer of the stock market’s health.
There’s a saying on Wall Street that nothing good happens below the 200-day moving average. And for the most part, that seems to be true. Since 1950, the S&P 500 has stayed above its 200-day moving average in 80% of the days during bull markets versus just 28% for bear markets.
A couple of days below the 200-day moving average certainly doesn’t mean the bull market is dead—but it doesn’t help much, either. The longer stocks stay subdued, the more damage it does to the long-term trend.
Indeed, according to our Adaptive Moving Average indicator (shown below), the stock market’s primary trend is now decidedly down.
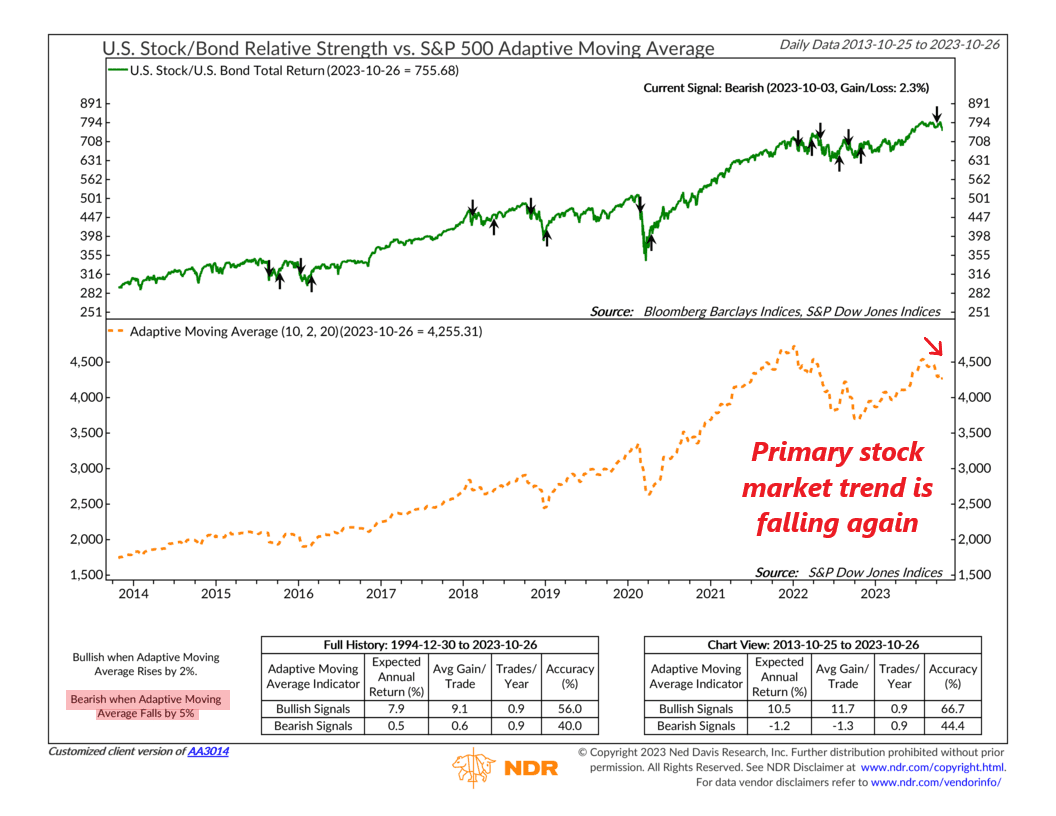
This indicator combines short-, intermediate-, and long-period moving averages of the S&P 500 to determine its trend. In early October, it fell 5% from its recent peak, triggering a sell signal for stocks. That’s not a great sign.
One of the biggest concerns we have is that this selling pressure is occurring against the backdrop of a weak economic environment.
Sure, the latest GDP numbers showed rapid growth in the third quarter, with real (inflation-adjusted) economic output expanding at a 4.9% annualized clip. But this is backward-looking data that confirmed what we already knew: that Americans went on a shopping spree in the third quarter.
The real question is: can this trend be sustained in the coming quarters?
According to the yield curve, the answer is probably not.
The difference between 10-year and 2-year Treasury yields has a good reputation for calling economic downturns before they start. In fact, as the chart below shows, whenever the 10-2 yield curve starts to “disinvert” or become less inverted, a recession is right around the corner (the grey-shaded areas represent economic recessions).
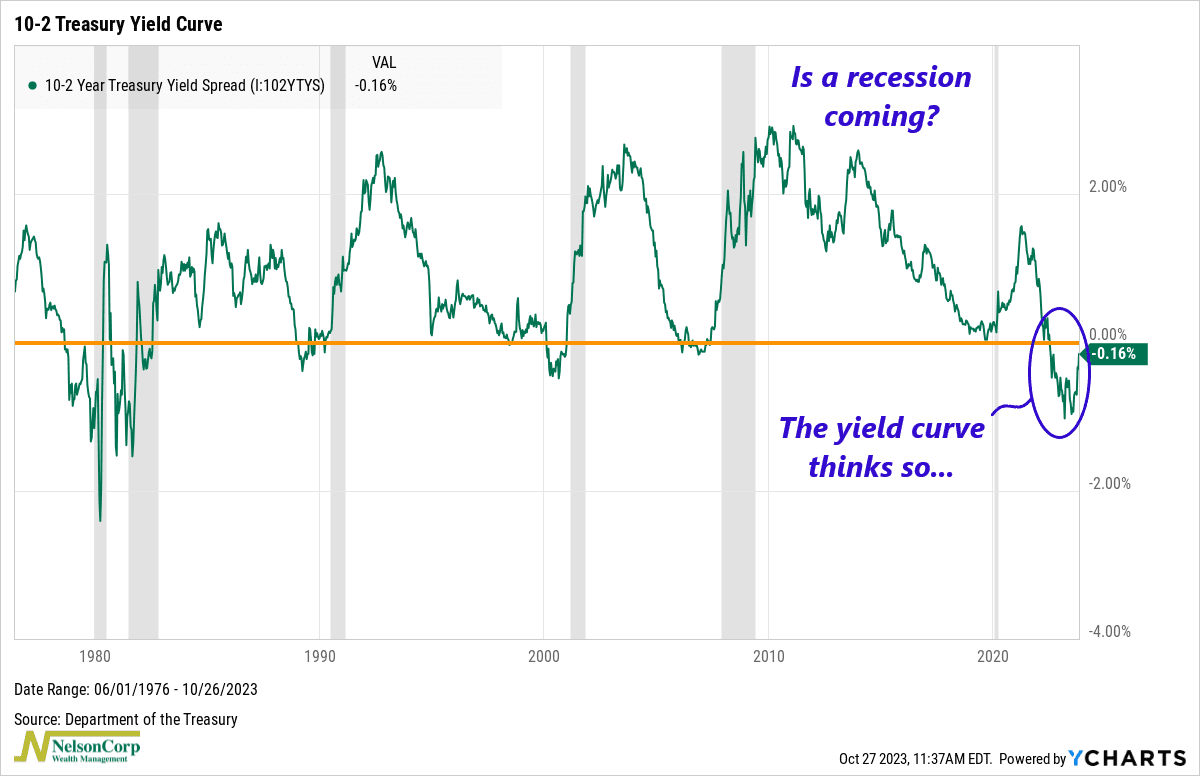
As you can see, the 10-2 yield curve has gone from -1.06% in June to just -0.16% today. If history is any guide, this means that an economic slowdown is likely coming.
With that said, though, the good news is that the labor market remains quite strong. It’s hard to see how the economy can go into recession when such a large percentage of people are still working and making money.
Another piece of potentially good news? Seasonality.
According to the chart below, the Dow typically experiences corrections or downturns in the spring and fall; this year has been no exception. We experienced a roughly 8% correction in March (the regional banking crisis), and here we are again, in the midst of a 9-10% correction.
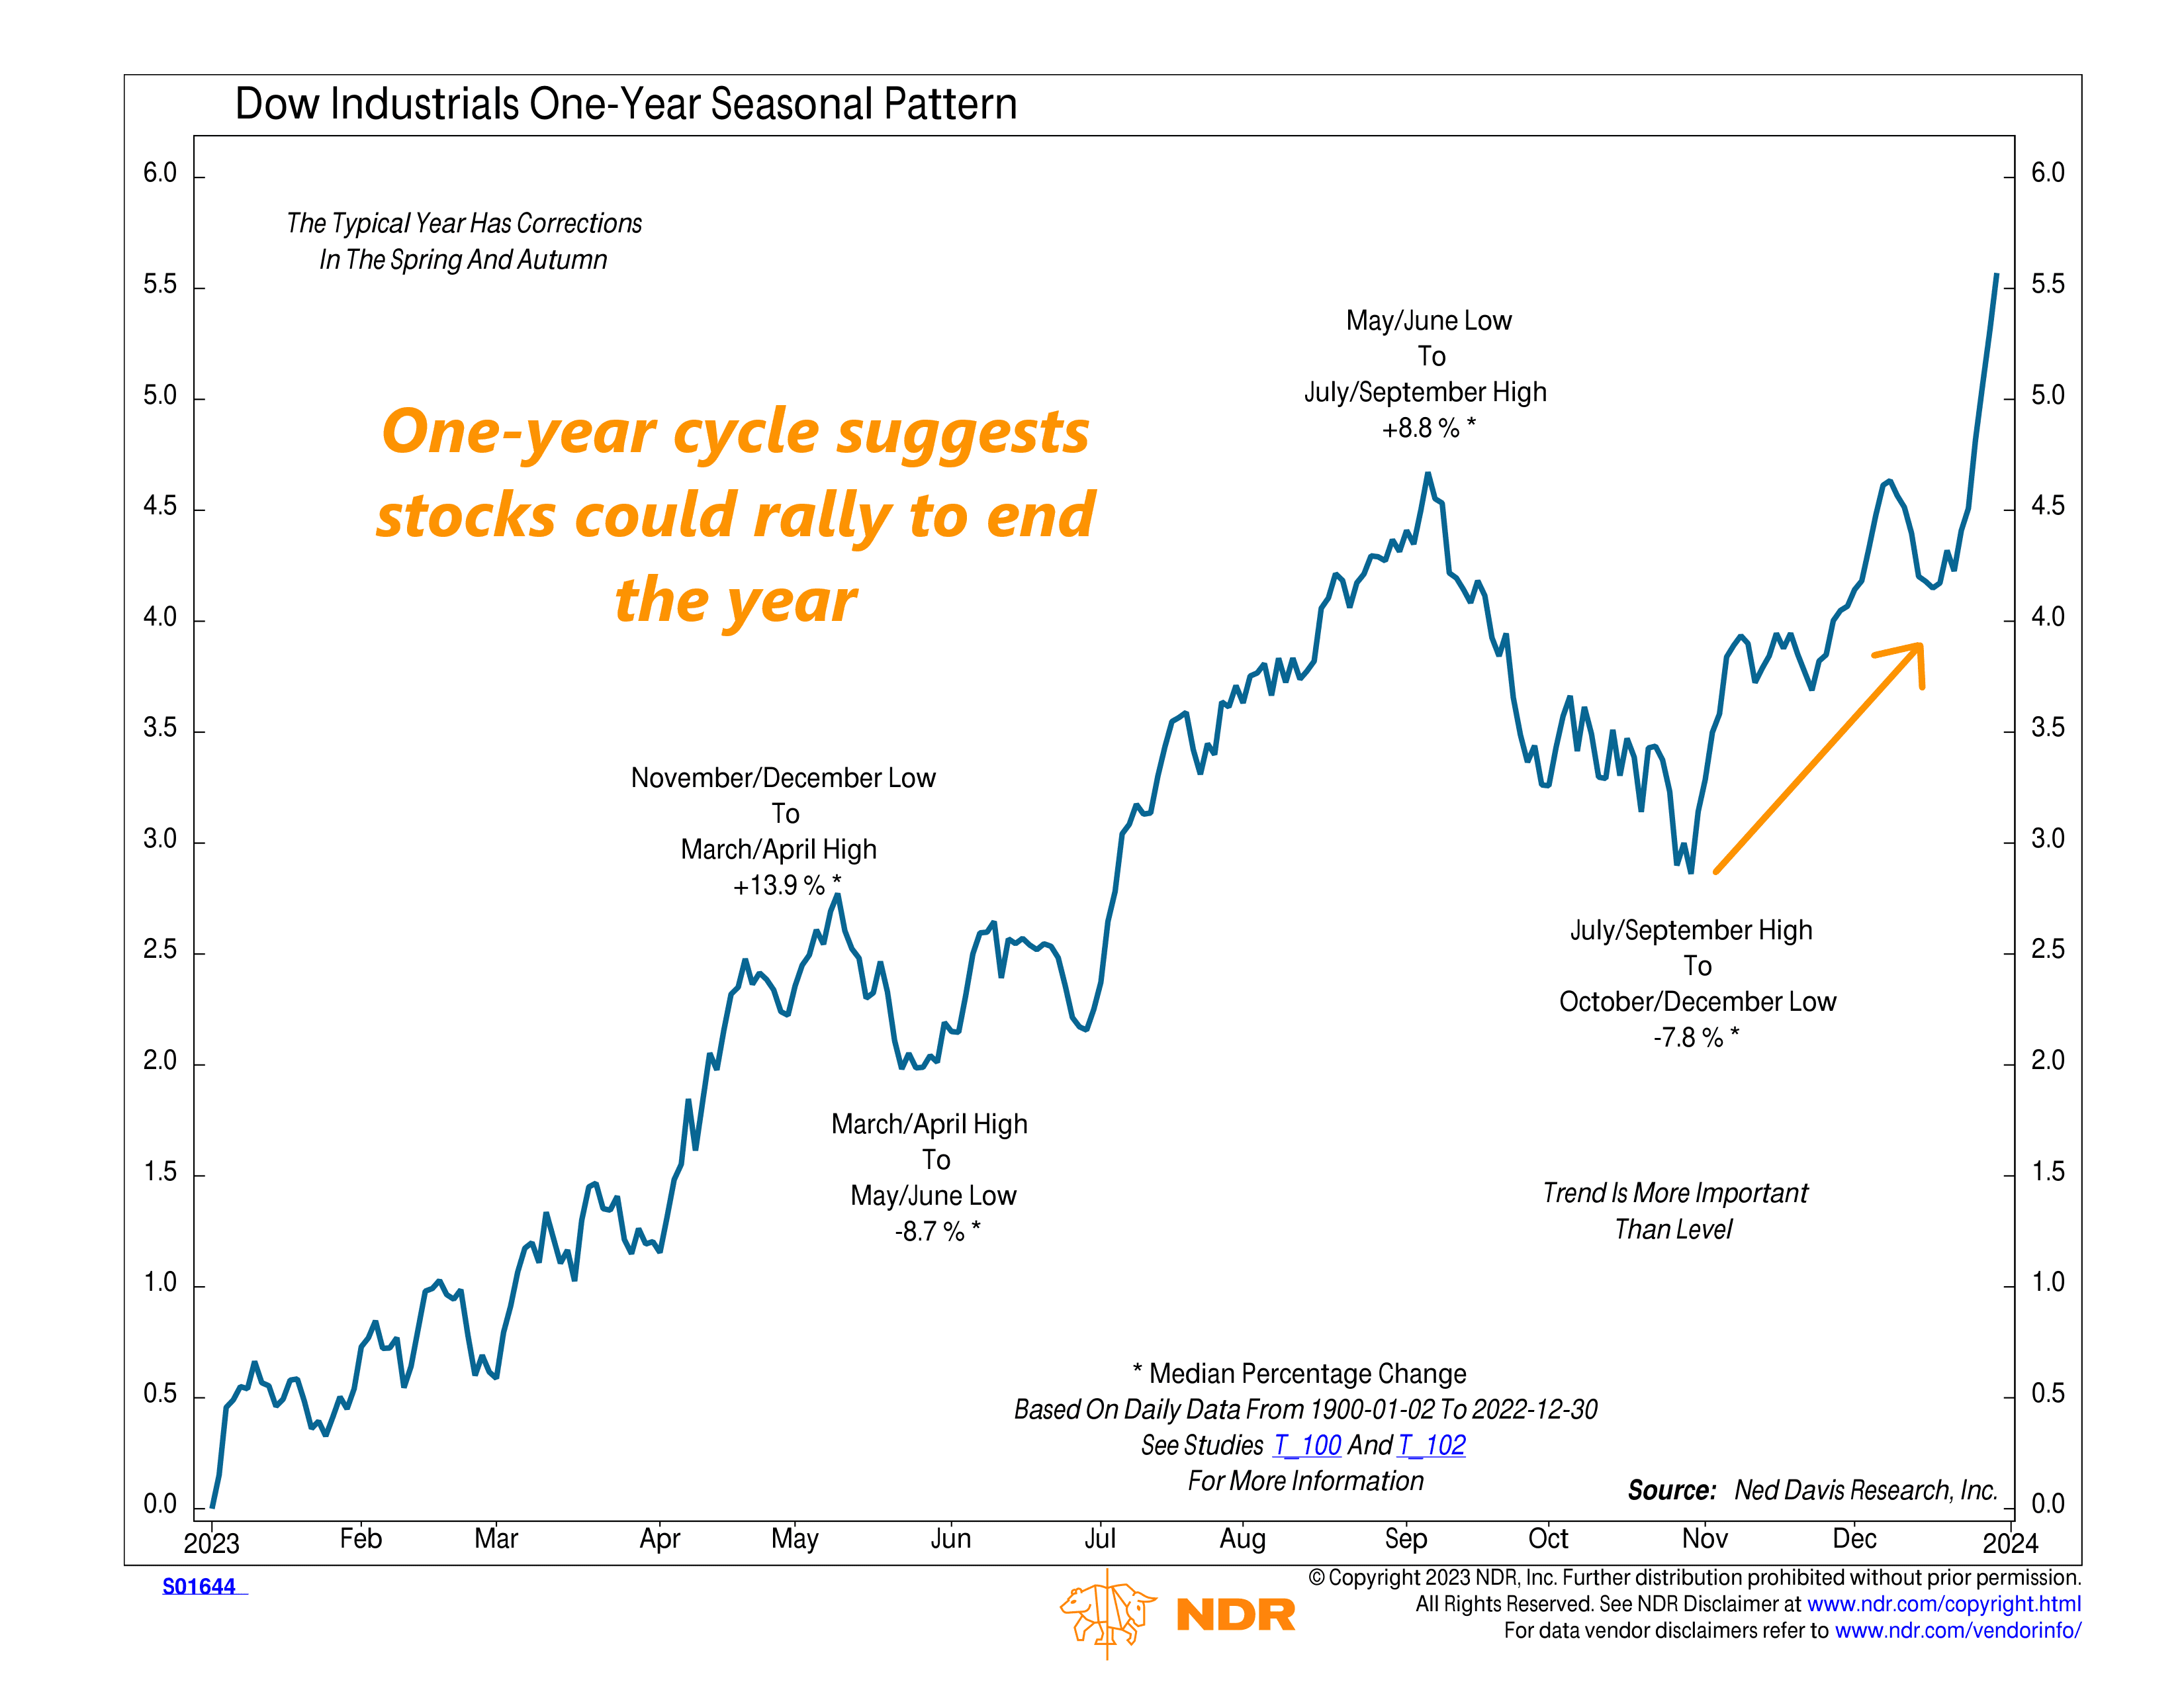
If the rest of the year plays out according to historical seasonality, the Dow should rebound in the last two months of the year. That’s not an iron-clad law or anything, but it’s at least something interesting to keep in mind.
So, the bottom line is that although we see seasonality as a potential bright spot towards the end of the year, the technical price action of the market continues to be a concern. If the economy falls into recession—as the yield curve suggests—stocks could suffer more. If the labor market remains strong, however, perhaps a downturn can be avoided.
At the end of the day, we adhere to the weight of the indicator evidence, which remains low-neutral at best, teetering on the brink of going negative, implying that this isn’t the greatest time to be taking unnecessary risks.
This is intended for informational purposes only and should not be used as the primary basis for an investment decision. Consult an advisor for your personal situation.
Indices mentioned are unmanaged, do not incur fees, and cannot be invested into directly.
Past performance does not guarantee future results.
The S&P 500 Index, or Standard & Poor’s 500 Index, is a market-capitalization-weighted index of 500 leading publicly traded companies in the U.S.
The post Sagging Stocks first appeared on NelsonCorp.com.