OVERVIEW
It was a mixed bag of results for the major U.S. stock indices last week. While the tech-heavy Nasdaq fell 1.9%—its second straight weekly decline—the Dow rose 0.62%, its fourth weekly gain in the past five weeks. The S&P 500 ended somewhere in the middle, down about 0.3% for the week, also its second straight weekly decline.
The market was split between value stocks, which rose 0.25% for the week, and growth stocks, which fell 1.1%. Small-cap stocks were also down around 1.26%.
Foreign stocks didn’t see much in the way of gains either. Developed country markets were down 0.65%, and emerging markets fell nearly 2%.
Bond yields continued to tick higher last week, with the benchmark 10-year Treasury rate rising to 4.15% from 4.05% the week before. While most bond prices were down for the week, high-yield (junk) bonds managed to gain around 0.3%.
Real estate saw a moderate gain of 0.4% for the week. Commodities, however, were down 0.33% broadly. While oil climbed 0.62% and corn prices increased 0.62%, gold fell 1.5%. Finally, the U.S. dollar strengthened nearly 1% for the week.
KEY CONSIDERATIONS
Respect the Trend, but Heed the Rates – Someone once said that trends, like horses, are easier to ride in the direction they are going.
The same can be said of the stock market. More often than not, it pays to invest alongside the stock market’s long-term trend instead of against it.
Now, there are various ways to measure the stock market’s trend—and we implement several such indicators in our models, with various time frames—but the following chart is the type of measure that can identify very long-term turning points in the market.
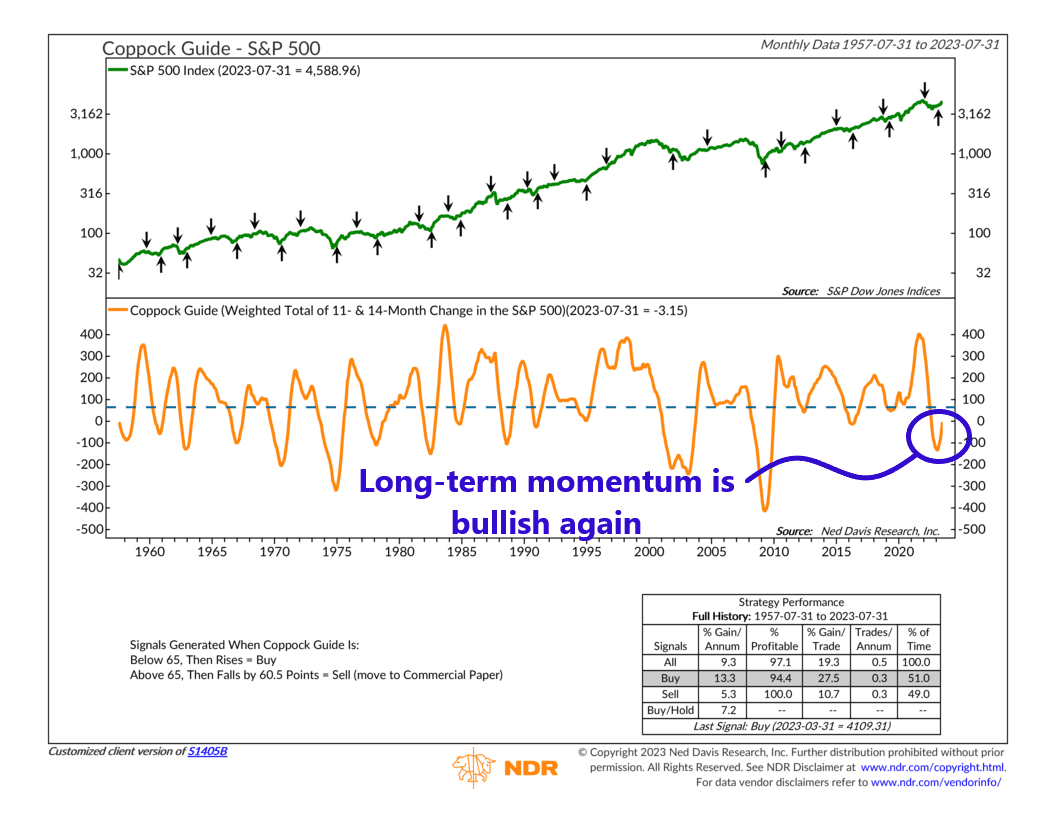
It’s called the Coppock Curve. It’s found by taking the 10-month weighted moving average of the sum of the 14-month rate of change and the 11-month rate of change of the S&P 500 stock index.
In other words, it measures the stock market’s long-term momentum. And as of March, it says that the stock market’s long-term momentum is decidedly positive.
This adds further weight to the accumulating evidence that the stock market’s downside momentum from last year has given way to upside momentum this year.
It’s also good for returns. Since 1957, buy signals from the Coppock Curve indicator have coincided with above-average stock market gains—13.3% per year, on average, to be exact.
But while the stock market’s price movements have looked strong lately, the macro data leaves much to be desired.
Interest rates, in particular, have been an issue for stocks lately. The benchmark 10-year Treasury yield has been above 4% for a couple of weeks now. And as a result, our long-term bond yield indicator, shown below, recently triggered a sell signal for stocks.
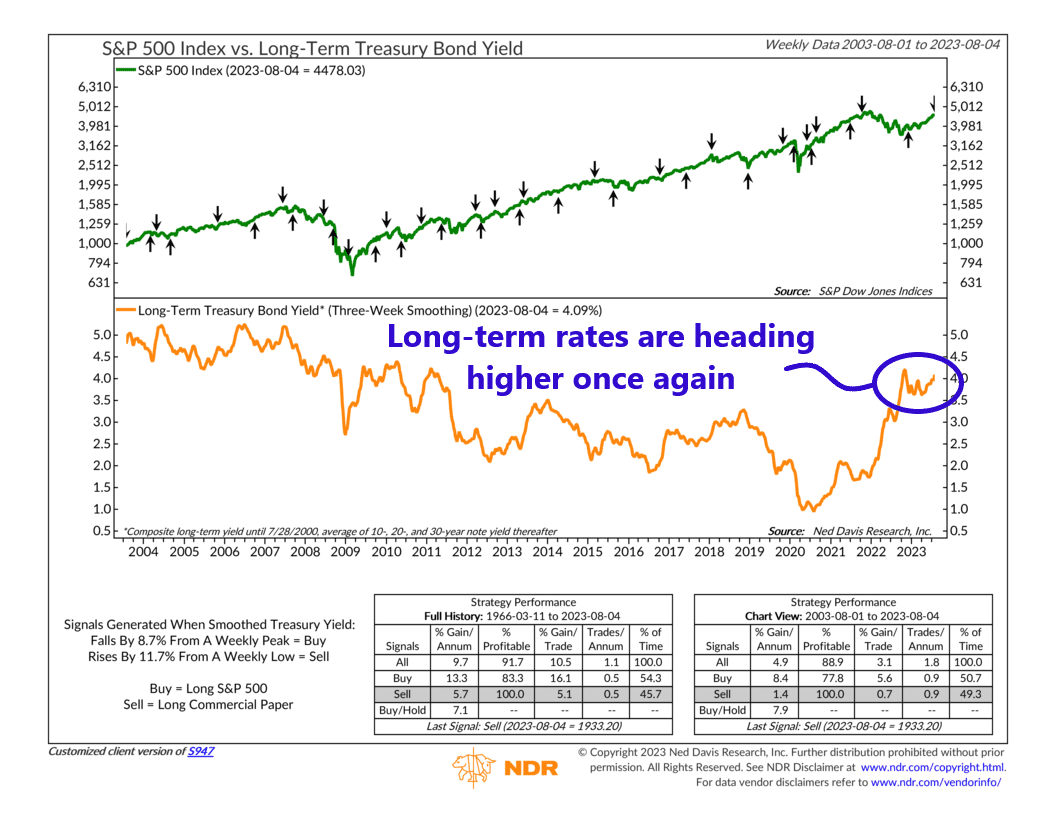
According to the rules of the indicator, a sell signal is generated for the S&P 500 when long-term rates rise by 11.7% or more from a weekly low. That is precisely what happened a week ago.
This is a bit concerning because, historically, stock returns have been weaker than average in this sort of rising-rate environment.
So, the main takeaway from all this is that the stock market is primarily being driven higher by what we call strong price action. Many of the external factors that influence stock returns, such as interest rates, are either neutral or negative at this time. The weight of the evidence still suggests that stocks are biased to move higher in this sort of environment. But the strength of the move is not as bullish as it could be—at least for now.
This is intended for informational purposes only and should not be used as the primary basis for an investment decision. Consult an advisor for your personal situation.
Indices mentioned are unmanaged, do not incur fees, and cannot be invested into directly.
Past performance does not guarantee future results.
The post Respect the Trend, but Heed the Rates first appeared on NelsonCorp.com.