OVERVIEW
The U.S. stock market made a significant recovery last week, with the Dow gaining 0.67%, the S&P 500 rising 2.67%, and the Nasdaq surging 4.23%. This rebound was particularly led by growth stocks, which outperformed value stocks with a gain of 3.68% versus 1.5%. Small-cap stocks also saw a positive trend, rising about 2.4%.
Foreign stocks did well, too. Developed countries rose 1.74%, and emerging markets rocketed up 3.72%.
While the stock market was on an upswing, the bond market faced some challenges. The yield on the benchmark 10-year Treasury Note rose to 4.67%, impacting the performance of long-dated Treasuries, which declined 0.9%. Overall, the U.S. bond market was down about 0.04%.
Heading over to the real asset space, we saw real estate gain 1.47% and commodities decline 0.13%. While oil increased about 1.95%, gold fell 2.76%. The U.S. dollar remained flat for the week.
KEY CONSIDERATIONS
Regaining Possession – Watching the stock market this year has been like watching a basketball player dribble down the court.
Bounce, bounce, bounce.
That’s what the S&P 500’s drawdown chart (shown below) has been doing all year. The market would reach a new high, fall about 1%, and then bounce to another new high.
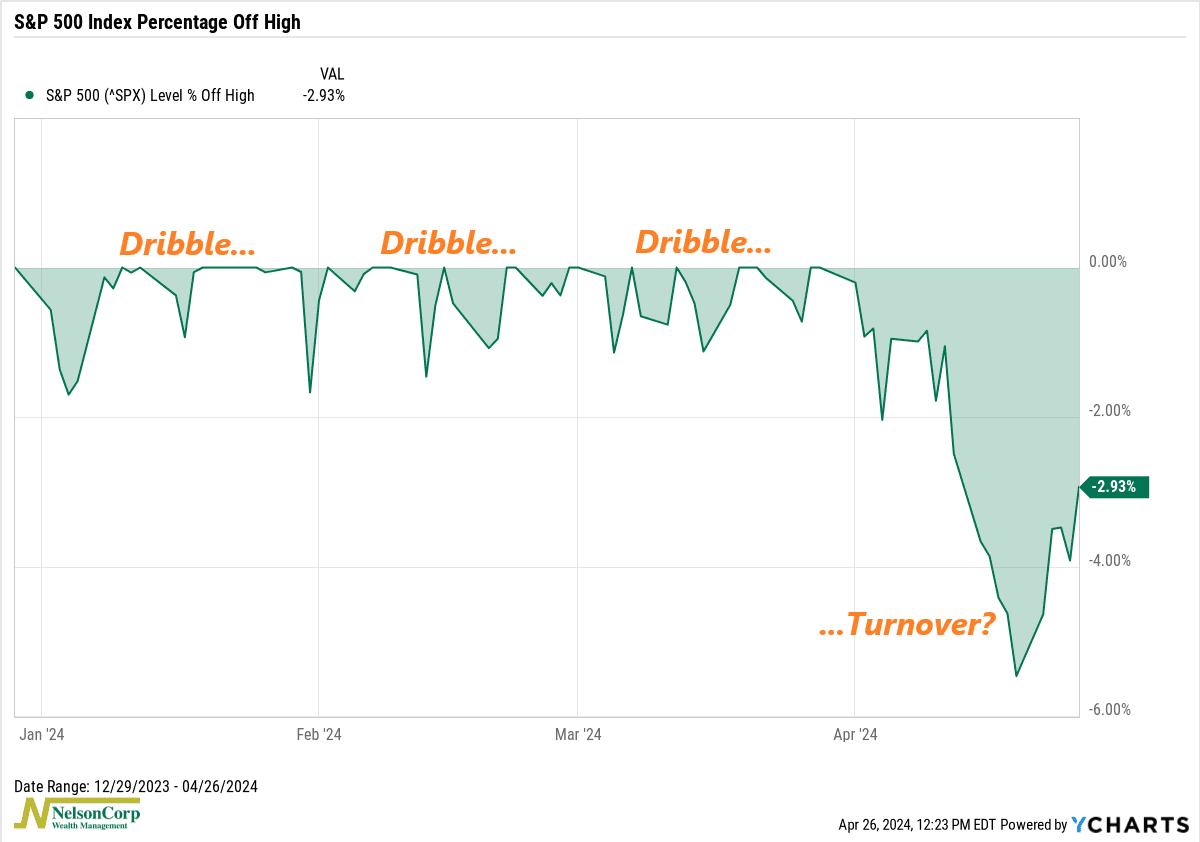
That is, until about a month ago when the market lost possession of the ball. The S&P 500 took a little nosedive, falling about 5.5% from its all-time peak.
But then, after falling for six consecutive sessions, the S&P 500 bounced back over 2.5% last week.
So that’s got us asking: Has the market regained possession?
Well, let’s look at a price-based measure first. The following indicator is called an 85-day Stochastic. It measures stock market momentum over the past 85 trading days. It shows that although the market exhibited strong momentum to start the year, it also left the market overbought. It fell from a high level and triggered an overbought bearish signal on April 15th.
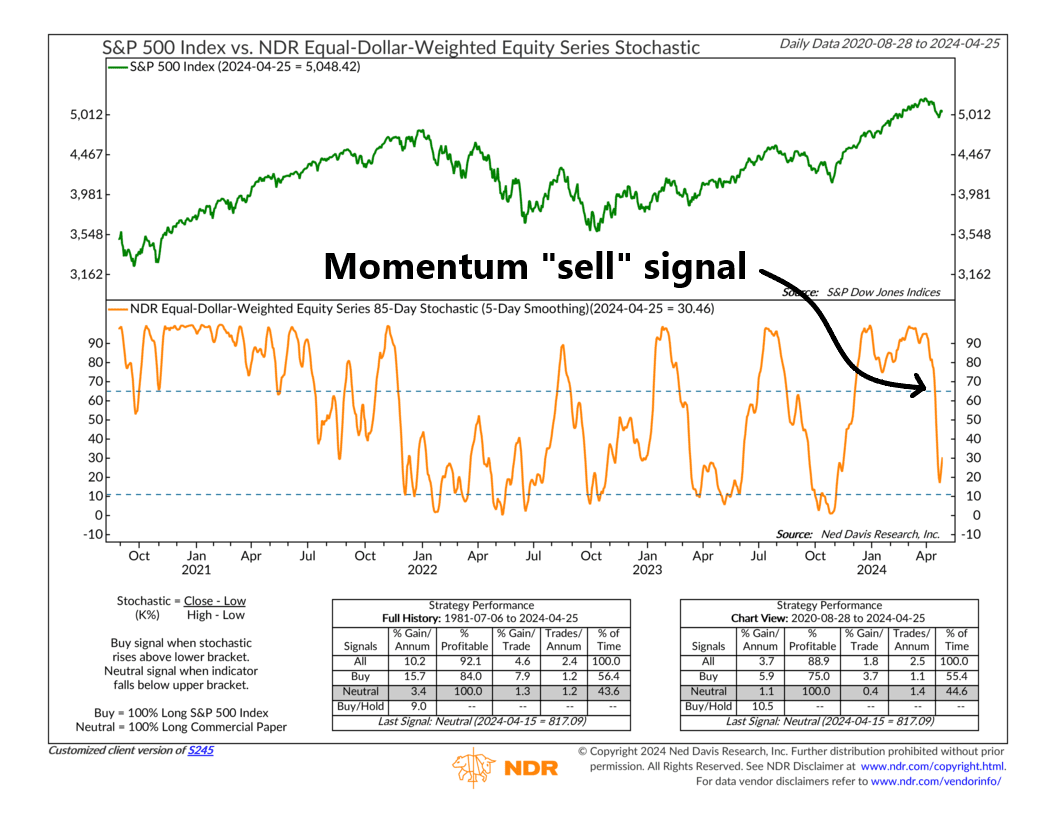
Historically, this has been a shaky position for the market to be in. It indicates a weakening in the market’s upward momentum. Best case scenario: We see the indicator fall below the lower bracket (oversold territory) and reverse quickly (triggering a bullish signal) before the market’s momentum takes on any more damage.
As for other areas of the market—like Volume Supply and Demand—we have seen some deterioration, but not enough to trigger a warning just yet. As you can see on the chart below, Volume Supply, the total volume of declining stocks on the day, has been quickly approaching Volume Demand, which is the total volume of advancing stocks.
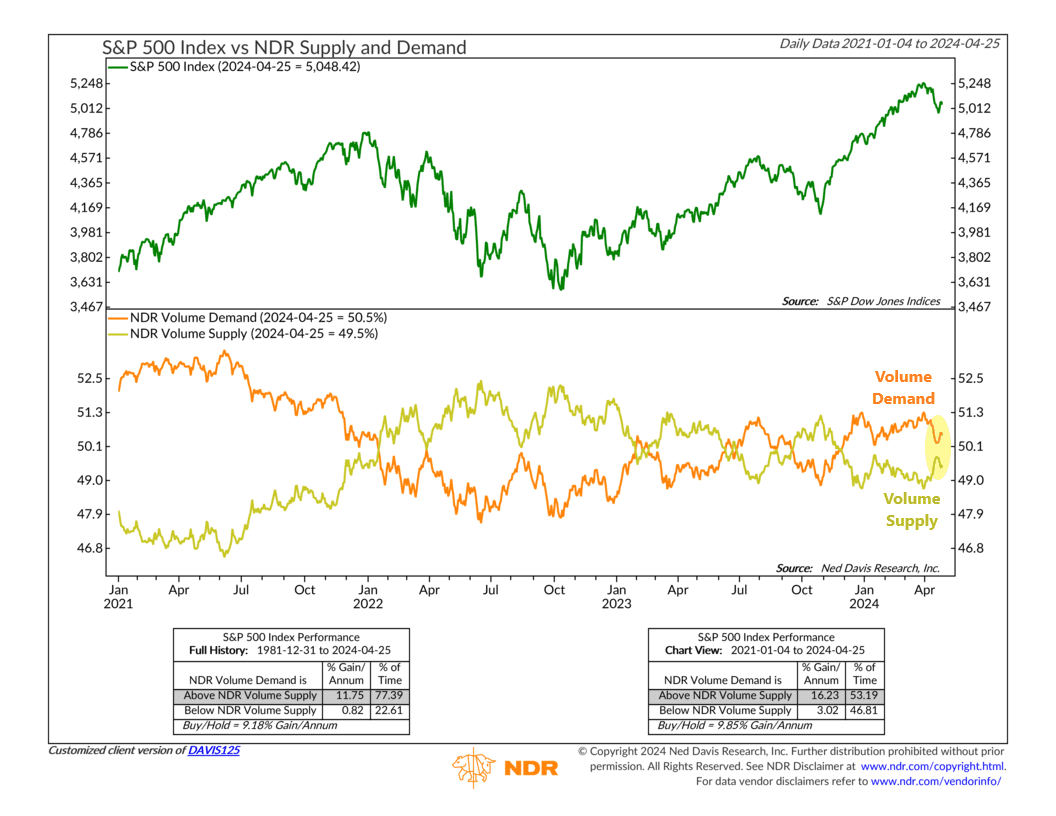
If Volume Supply does surpass Volume Demand in the coming weeks, it would be a sign that the “sellers” are gaining the upper hand in the market. For now, however, the buyers remain in control, so that’s a positive.
But perhaps the most encouraging sign that the market might be able to regain possession here is due to this last chart, showing the NDR Daily Trading Sentiment Composite. This is a special type of indicator—a composite indicator—that we use to spot short-term shifts in how investors feel about the market. It brings together various indicators to show what many different types of investors are thinking. By pinpointing when sentiment reaches extreme levels, it can guide decisions like making trades that go against the current trend.
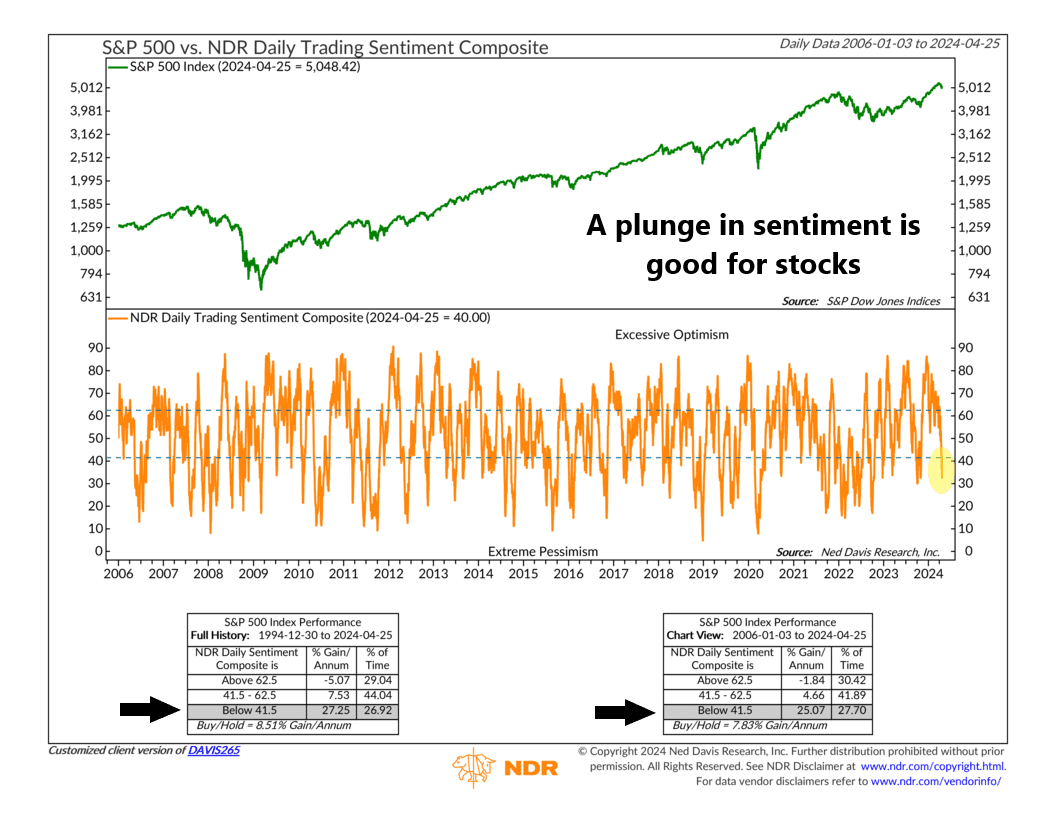
And that’s just what it did after the recent market decline. It dropped into its lower “extreme pessimism” zone. Historically, sharp drops in sentiment like this have helped spur rallies in the S&P 500 Index—meaning it’s bullish—and we think this might have something to do with the turnaround in stock prices last week.
So, the bottom line is that we do see some encouraging signs that the market has attempted to regain possession of the ball after last week. The majority of the indicators that we track continue to lean bullish, so we’d say the market environment remains positive for now.
This is intended for informational purposes only and should not be used as the primary basis for an investment decision. Consult an advisor for your personal situation.
Indices mentioned are unmanaged, do not incur fees, and cannot be invested into directly.
Past performance does not guarantee future results.
The S&P 500 Index, or Standard & Poor’s 500 Index, is a market-capitalization-weighted index of 500 leading publicly traded companies in the U.S.
The post Regaining Possession first appeared on NelsonCorp.com.