OVERVIEW
The U.S. stock market rebounded in dramatic fashion last week. The VIX index, a measure of implied volatility and Wall Street anxiety dropped by over 6 points to just under 15.
Smaller companies (small caps) led the way with an impressive 7.6% surge in the Russell 2000 index. The tech-heavy Nasdaq followed closely with a 6.6% increase. The broader S&P 500 index rose 5.9%, and the Dow Jones Industrial Average increased 5.1%. As a category, growth stocks did just slightly better than value, with a 6.3% increase compared to the 5.7% increase for value stocks.
It wasn’t just the U.S. markets that saw gains; foreign stock markets also had a strong week. Developed countries’ markets increased by 6.3%, and emerging markets saw a 4.6% rise.
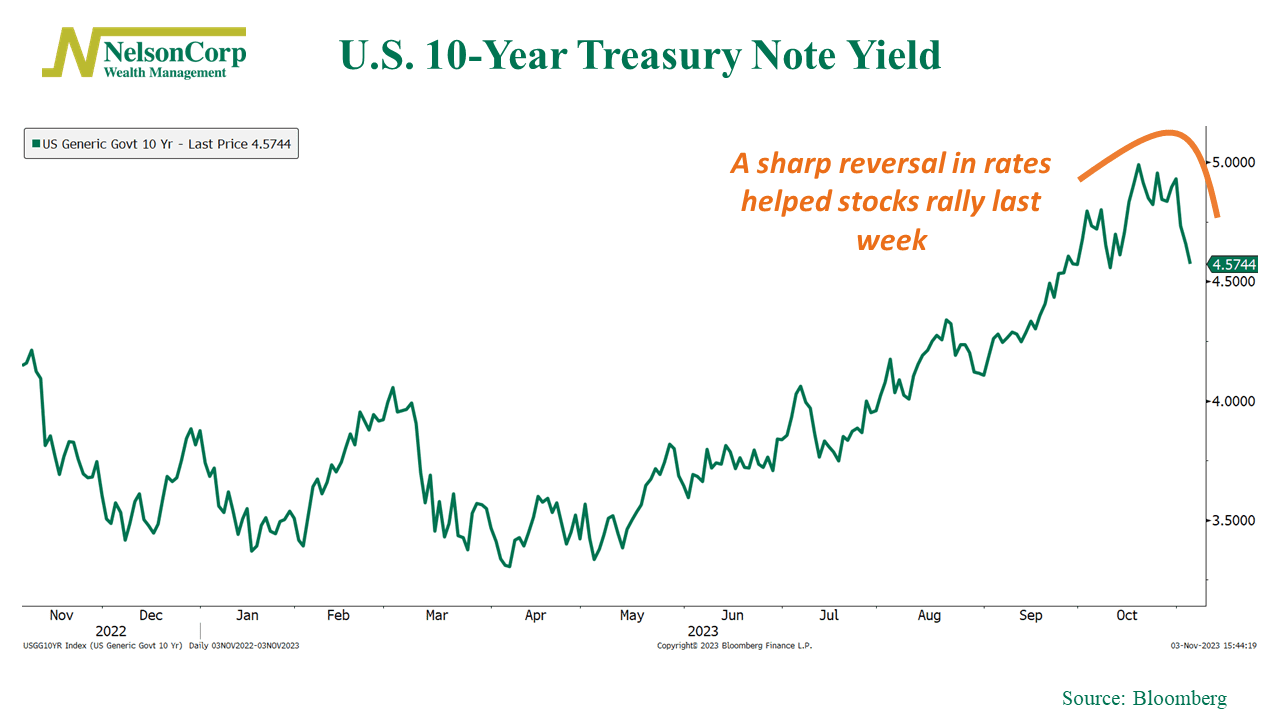
It was a great week for Treasury bonds. The yield on the benchmark 10-year Treasury note dropped to about 4.52%, down from nearly 5% just a few weeks ago. As a result, intermediate-term Treasuries saw price gains of around 1.7%, while longer-duration bonds performed even better, surging by about 3.9%.
Real estate had the best performance among all asset classes, with an impressive 8.9% increase. On the other hand, commodities didn’t do as well, experiencing a broad decrease of approximately 1.4%. This was primarily due to a 4.5% drop in oil prices and a 0.8% decrease in gold prices. Among agricultural products, wheat fell by 0.5% and corn dropped by 0.7%, while soybeans increased by 2.4%. Finally, the U.S. dollar weakened by about 1.2% for the week, easing up on its gains for the year.
KEY CONSIDERATIONS
Rebound – The stock market staged an impressive comeback last week. After last week’s gain of 5.9%, the S&P 500 is back to where it was about two weeks ago, just before it entered correction territory.
A few factors fueled the rebound.
Falling interest rates were one. The Federal Reserve paused its rate hikes last week, and a recent uptick in the unemployment rate caused a sharp reversal in the 10-year Treasury rate. It was 5% just a couple of weeks ago. It closed at roughly 4.5% on Friday.
Another contributing factor was a rise in bearish sentiment among investors. More than 50% of survey respondents reported bearish (negative) feelings about the stock market last week, a majority for the first time since last December.
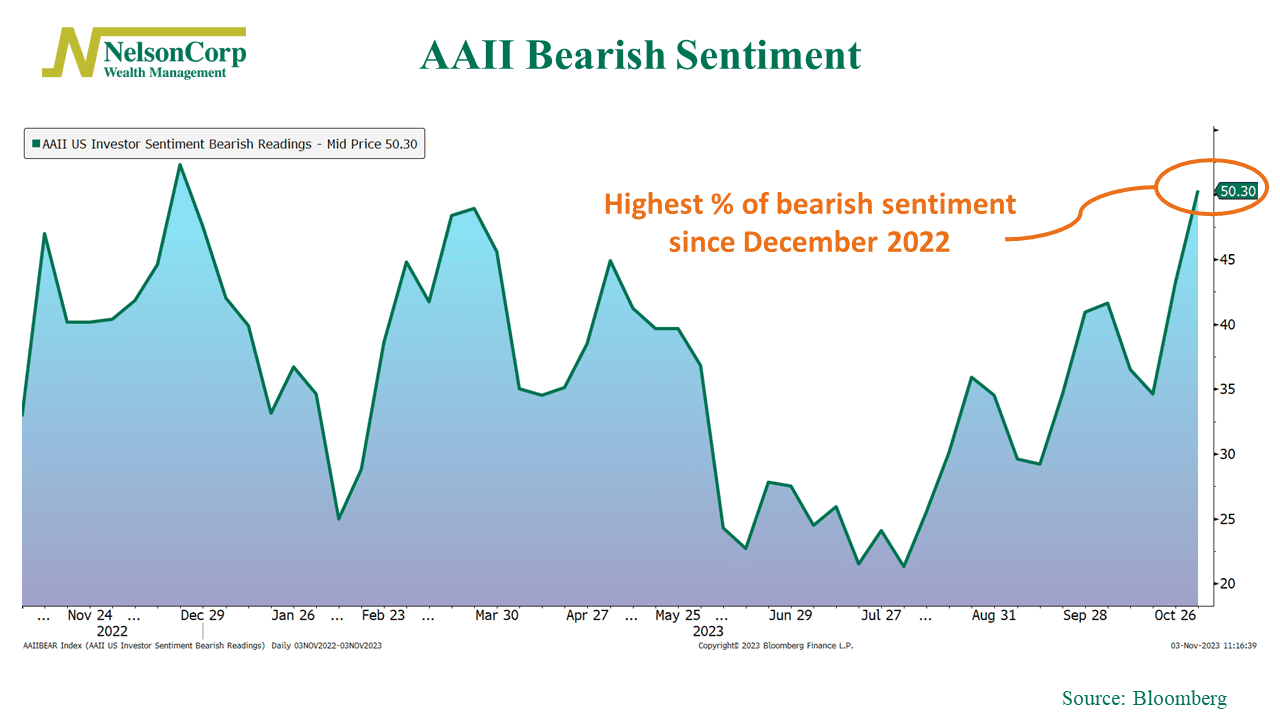
Perhaps counterintuitively, we see this as a positive contrarian indicator, as extreme negative sentiment can sometimes lead to strong stock market rallies.
But while last week’s bounce in the stock market was impressive, the weight of the evidence suggests there’s still more work to be done.
Looking at a technical chart of the S&P 500 Index, we see that stocks are still trading below a key level of resistance created by the summer “topping pattern” (or the neckline of the Head & Shoulders pattern, to use the technical jargon).
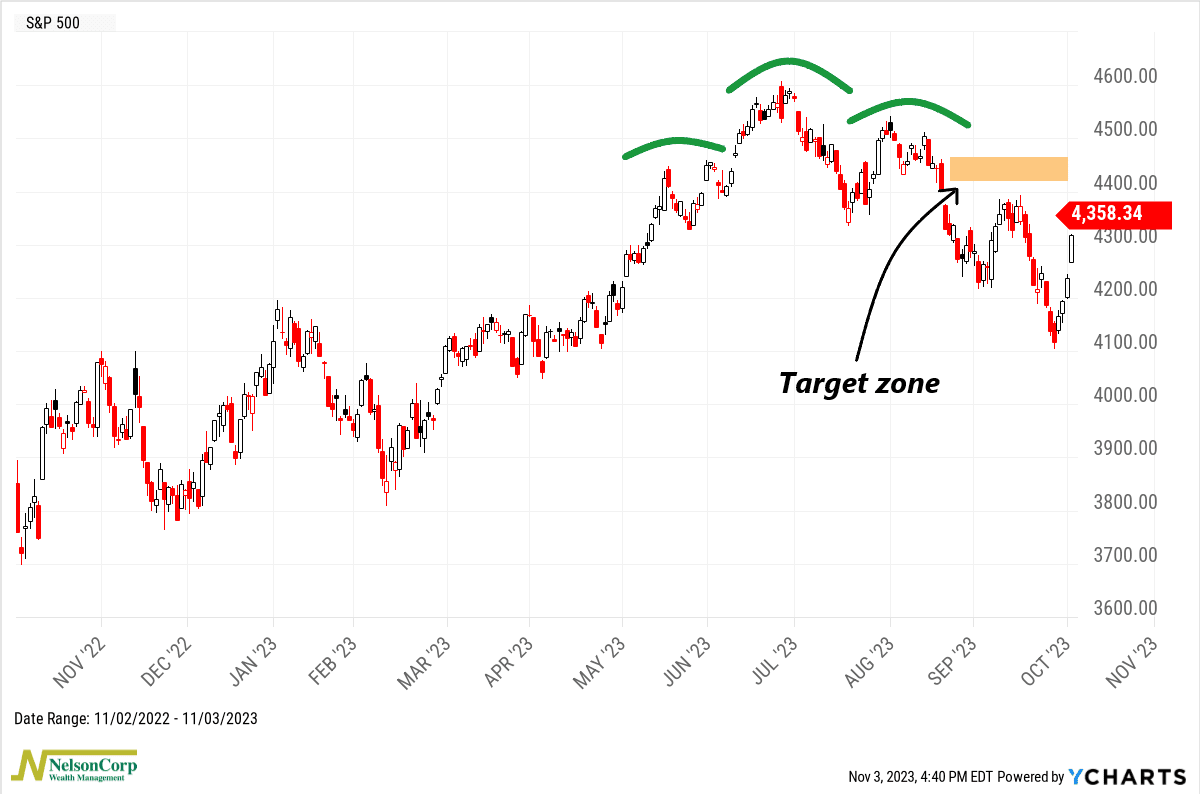
Ultimately, we’d like to see the S&P 500 Index get to an index level of above 4460 or so (roughly 8.4% higher from the correction low), as that would be a sign that the downtrend has exhausted itself and is starting to move higher again.
Longer-term, we also have some ongoing concerns about the current investment environment.
Valuations, for instance, are running higher than normal.
The famous Shiller CAPE Ratio (shown below) compares stock prices to inflation-adjusted earnings of the S&P 500 Index over the past decade. It’s currently 30.81, well above its long-run average of 26.73.
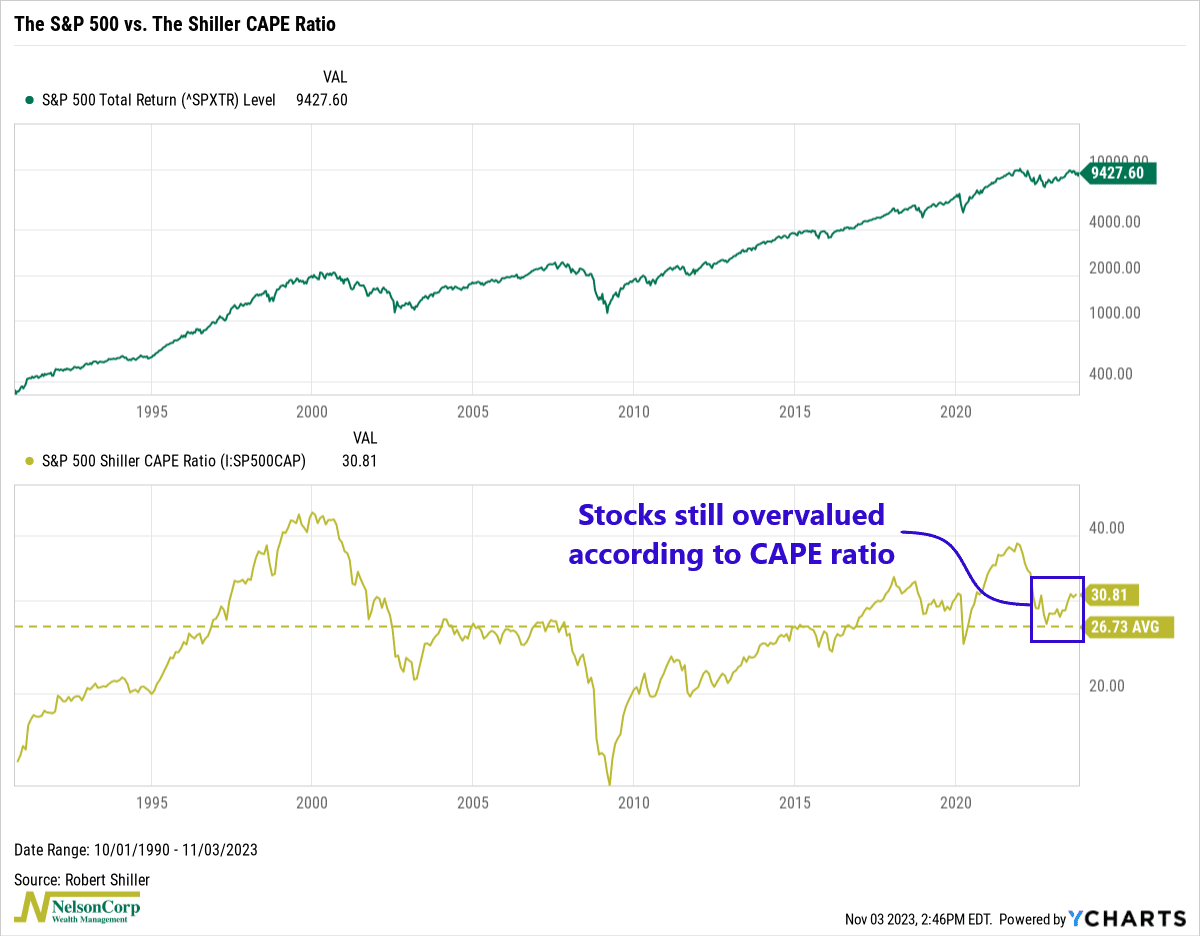
While not necessarily “bubble territory,” this does suggest that stocks might be somewhat overvalued when compared to the profits generated by the underlying companies.
So, putting it all together, we’d say that counter-trend rallies—like the one we saw last week—can be appealing. Many times, they are sudden, severe, and even seductive. But it’s essential not to get carried away by short-term price movements. Instead, we should wait for confirmation from the weight of the evidence.
And the current evidence suggests that the market needs to prove itself in the coming weeks by following up last week’s price action with further strength.
This is intended for informational purposes only and should not be used as the primary basis for an investment decision. Consult an advisor for your personal situation.
Indices mentioned are unmanaged, do not incur fees, and cannot be invested into directly.
Past performance does not guarantee future results.
The S&P 500 Index, or Standard & Poor’s 500 Index, is a market-capitalization-weighted index of 500 leading publicly traded companies in the U.S.
The post Rebound first appeared on NelsonCorp.com.