OVERVIEW
All three major U.S. stock indices fell more than 2% last week as the S&P 500 and the Nasdaq recorded their third consecutive weekly declines. Small-cap stocks performed even worse, dropping around 3.4% for the week.
Even foreign stocks were under pressure, with developed countries dropping 3.36% and emerging markets down 3.34%.
Putting pressure on stocks were bond yields, which rose briskly on the back of the release of the latest Federal Reserve meeting minutes and fresh economic data, which bolstered expectations that interest rates are likely going to remain higher for longer. The 10-year Treasury yield briefly touched 4.3% on Thursday, the highest since November 2007.
Real estate had a rough week, dropping nearly 3.5%. Commodities also fell around 1.27% broadly. Oil led the decline, down 1.97%, followed by a 1.55% drop in gold prices. Corn, however, rose about 1.2%. And the U.S. dollar strengthened 0.7%.
KEY CONSIDERATIONS
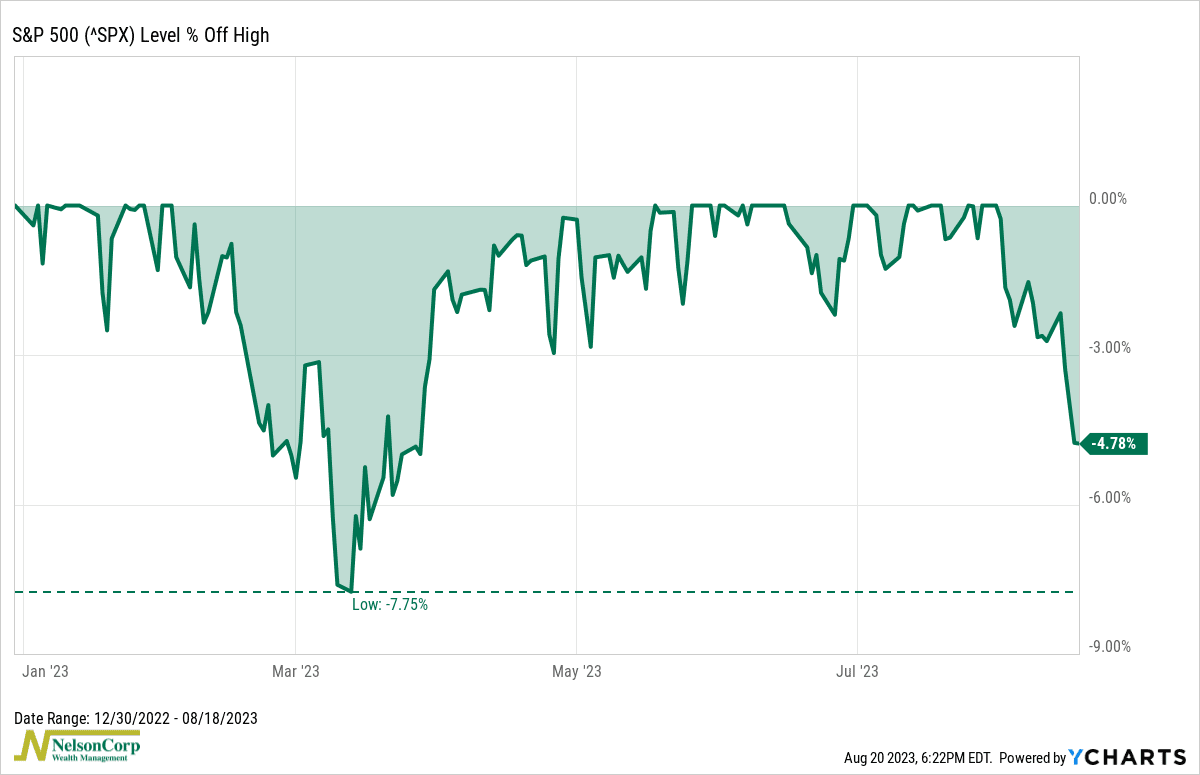
Price Weakness – The U.S. stock market continued to feel the selling pressure last week. After last week’s decline, the market is now down roughly 4.8% from its year-to-date highs.
But that’s not even the S&P 500’s largest decline of the year. As the chart below shows, March saw a 7.75% peak-to-trough decline.
On average, the S&P 500 experiences a drawdown of anywhere between 14% and 20% per year, depending on the time frame considered. So, by that fact alone, it wouldn’t be too surprising to see some further stock price weakness before the year ends.
To put some meat on the bones of that statement, we did see some deterioration in a variety of our price-based indicators last week, suggesting that the current environment is less friendly to stocks than before.
For example, one indicator in particular that we had our eye on is the 85-day stochastic, shown below. In a nutshell, this indicator uses a momentum-based calculation to determine if stocks are closing near the top or bottom of their recent price range, which can then help identify market reversals.
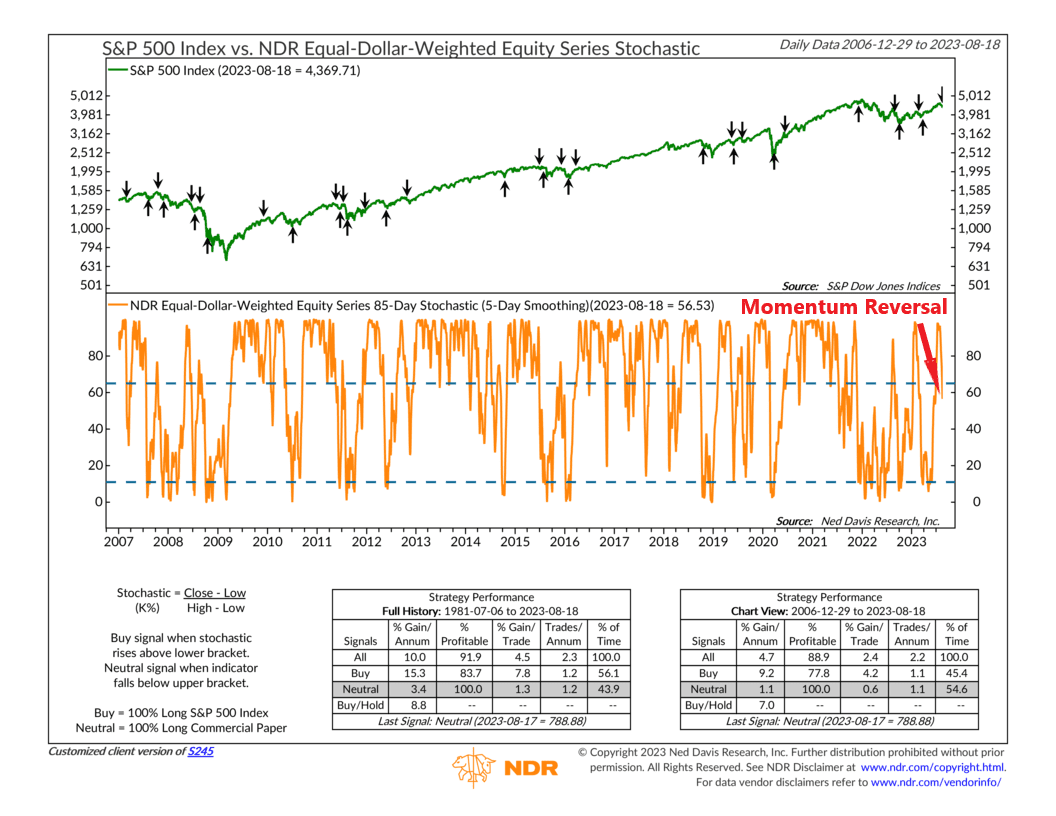
When it climbs above its upper bracket and then falls below it, the indicator triggers a sell signal for stocks.
This happened last week. And historically, this has foreshadowed below-average returns for the S&P 500 when it happens.
Now, as I said above, corrections are a regular and frequent occurrence in the stock market.
But the problem, as we mentioned last week, is that this price weakness is happening at a time when the external factors driving the stock market—investor behavior and economic data—are both weak. This essentially amplifies any changes that occur from the price movement area of our models.
Throw in the fact that we are also entering the most volatile time of year for the stock market from a seasonal perspective, and it really weakens the case for being overweight stocks at this time.
This is intended for informational purposes only and should not be used as the primary basis for an investment decision. Consult an advisor for your personal situation.
Indices mentioned are unmanaged, do not incur fees, and cannot be invested into directly.
Past performance does not guarantee future results.
The post Price Weakness first appeared on NelsonCorp.com.