OVERVIEW
Despite a bumpy ride, the U.S. stock market ended in positive territory again last week. The S&P 500 rose 1.38%, the Dow gained 1.43%, and the Nasdaq increased 1.12%. Small-cap stocks were left behind, however, dropping roughly 1% for the week.
Foreign stocks were mixed. While stocks in developed countries rose about 0.2%, those in emerging markets fell around 1.3%.
Bonds in general had a good week. Despite a surge on Friday, the benchmark 10-year Treasury yield was down compared to the week before, settling just a tad over 4%. The overall bond market was up around 0.5% as a result.
Commodities and real estate, however, had a poor week. Real estate declined about 0.77%, and commodities fell broadly by roughly 3.5%. A lot of the decline in commodities came from a 7%+ drop in oil. On a different note, the U.S. dollar gained approximately 0.5% by the week’s end.
KEY CONSIDERATIONS
Optimistic Streak –
Investors have been quite optimistic lately. After the stock market correction last October, surveys and polls of investor sentiment have shown increasing levels of cheerfulness among investors.
For example, the chart below features the NDR Crowd Sentiment Poll (orange line, middle clip), which consists of seven sentiment-based data series, ranging from individual and institutional investor surveys to market-based gauges like the put/call ratio. When it gets high, it’s a sign of increased investor confidence.
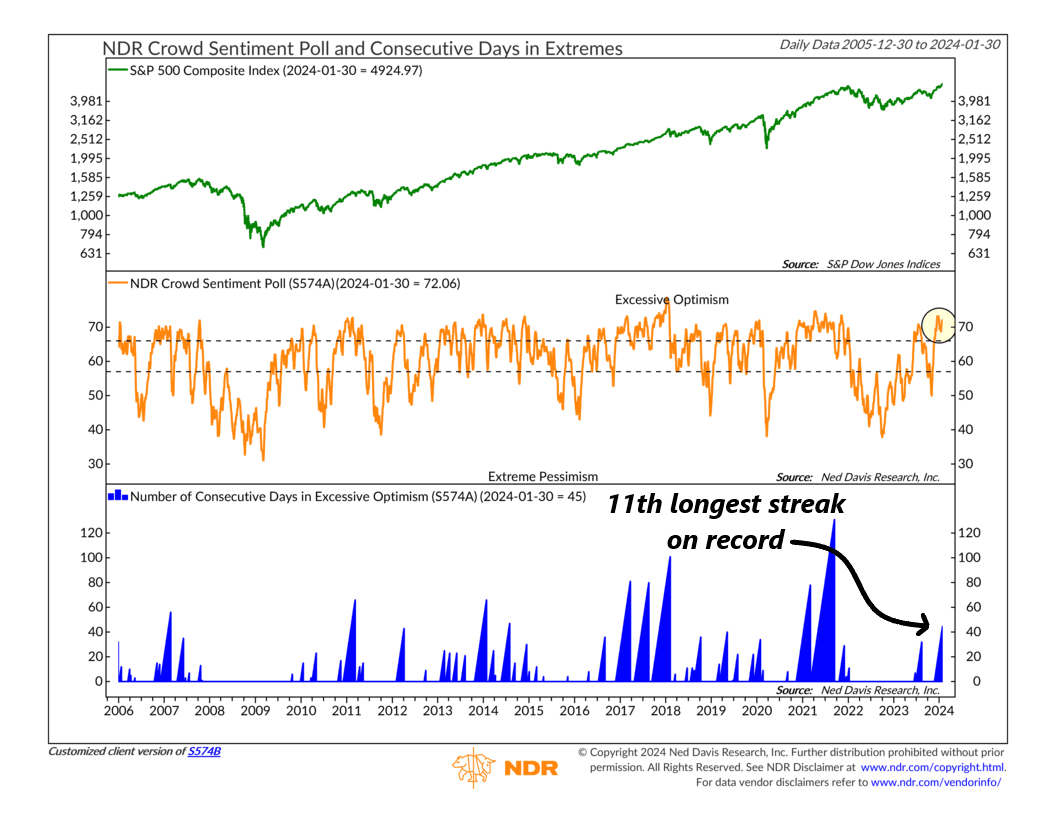
As you can see, it’s currently high—in its upper zone of extreme optimism. As the bottom clip of the chart shows, it’s now been in that extreme optimism zone for 45 consecutive days, its 11th longest streak on record since the data series began in 1995.
Now, you need bulls to have a bull market, so widespread optimism isn’t necessarily bad. But the longer this optimism lingers, history shows that it increases the chance that returns will be lower than average once the extreme sentiment reverses.
In other words, the long-term health of this bull market might benefit if we see a pullback in sentiment come sooner rather than later.
With that said, however, we do find that regardless of what the investor sentiment or economic landscape looks like, stock market returns are usually pretty good as long as the price movement section of the market remains positive. There’s some nuance here, but for the most part, price movement matters a lot.
And right now, the price movement of the market is still positive. A helpful indicator to show this is what we call a deviation-from-trend-slope metric, shown below. It calculates the S&P 500’s trend by dividing its 3-month moving average by its 1-year moving average. It saw some deterioration last fall but has since reversed and is just 1.86% away from its peak.
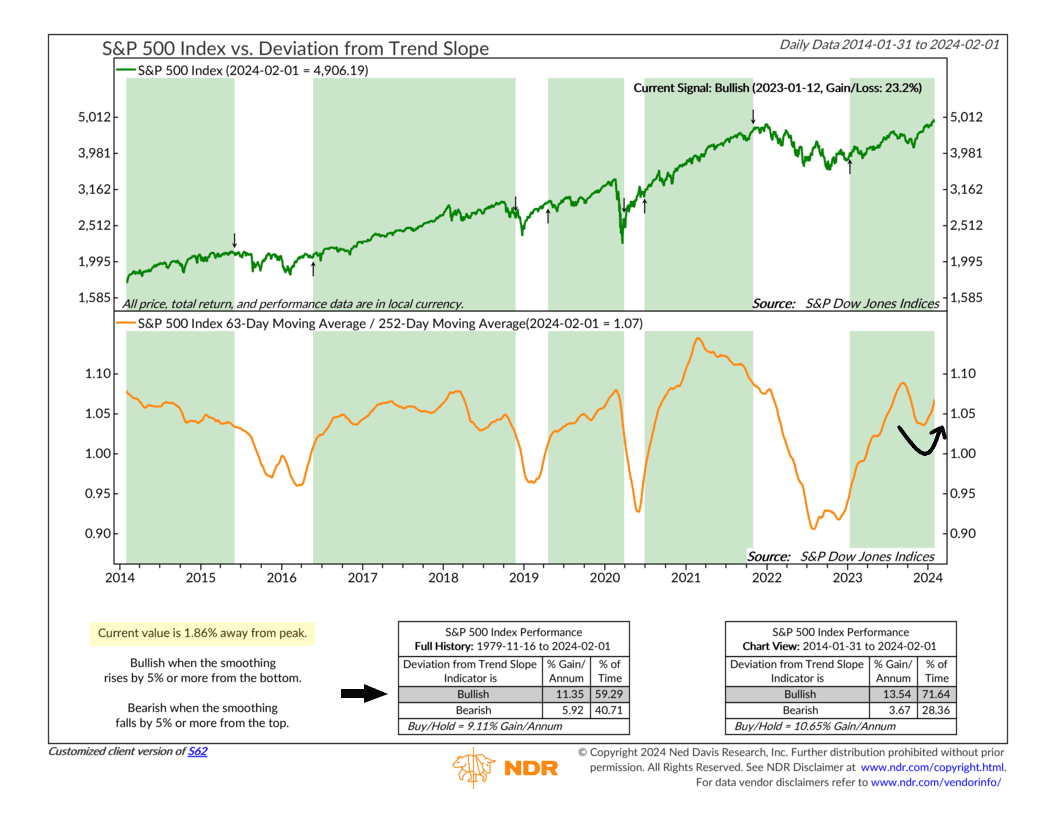
In other words, the stock market’s trend that began at the beginning of 2023 remains intact. Unless we observe extensive deterioration in price-based indicators like this one, a period of sustained broader stock market weakness is unlikely.
This is intended for informational purposes only and should not be used as the primary basis for an investment decision. Consult an advisor for your personal situation.
Indices mentioned are unmanaged, do not incur fees, and cannot be invested into directly.
Past performance does not guarantee future results.
The S&P 500 Index, or Standard & Poor’s 500 Index, is a market-capitalization-weighted index of 500 leading publicly traded companies in the U.S.
The post Optimistic Streak first appeared on NelsonCorp.com.