OVERVIEW
The U.S. stock market registered modest gains after a volatile week on Wall Street. The S&P 500 rose 0.4%, the Dow gained 0.24%, and the Nasdaq rose 0.43%.
Growth stocks were back in favor, gaining 0.83%, while value stocks fell 0.3%. Large-cap stocks did well, rising 0.64%, but small-caps suffered declines of 0.74%.
Emerging market stocks got hammered, slipping 2.75%. Developed country stocks did better but were still down about 0.09% for the week.
The yield on the U.S. 10-year Treasury note continued to fall and ended the week at 1.36%, down from 1.44% the prior week. Long-term bond prices rose 1.41% as a result. Similarly, investment-grade bonds gained 0.29%, high-yield (junk) bonds rose 0.2%, municipal bonds increased 0.37%, and inflation-protected Treasuries gained 0.07% for the week.
Real estate had a strong week, gaining 2.46%. Commodities did poorly, however. Oil dropped about 1%, corn fell roughly 10.5%, and gold saw gains of about 1.62%.
The U.S. dollar ticked lower, down 0.12% for the week.
KEY CONSIDERATIONS
No Trimming of Hedges – The U.S. stock market has been remarkably resilient this year. We’ve had a few selloffs here and there, but they were nothing worth writing home about. In fact, the S&P 500 index hasn’t had a drawdown of more than 5% all year.
This sort of price movement—along with a moderately bullish economic environment—has kept our primary stock market risk model mostly bullish all year.
However, the investor sentiment component of the model has seen persistent deterioration throughout the year. This is the contrarian piece of the model, so we’d expect it to worsen as investors get increasingly optimistic about the financial markets—something we’ve seen happen pretty consistently since November of last year.
To be sure, optimism isn’t bad; it can fuel a strong market uptrend. But eventually, it gets out of hand. And when things get too excessive, the market can shift on you. That tipping point is what interests us risk managers the most.
So, if you were to ask me where the risks in the stock market are today, I’d have to say that at least one danger lies in this environment of extremely optimistic sentiment. Looking at the numbers, the indicators that we use to measure market sentiment have collectively fallen to some of the lowest levels we’ve seen in years.
But, with that said, there are still some bright spots worth pointing out within that overwhelmingly negative sentiment component.
Take inverse ETF flows, for example. The chart below plots the 5-day cumulative flows into inverse S&P 500 funds. An inverse S&P 500 fund is designed to go up in price when the S&P 500 index goes down. Therefore, when flows into these funds are positive, it means investors are applying hedges to their portfolios.
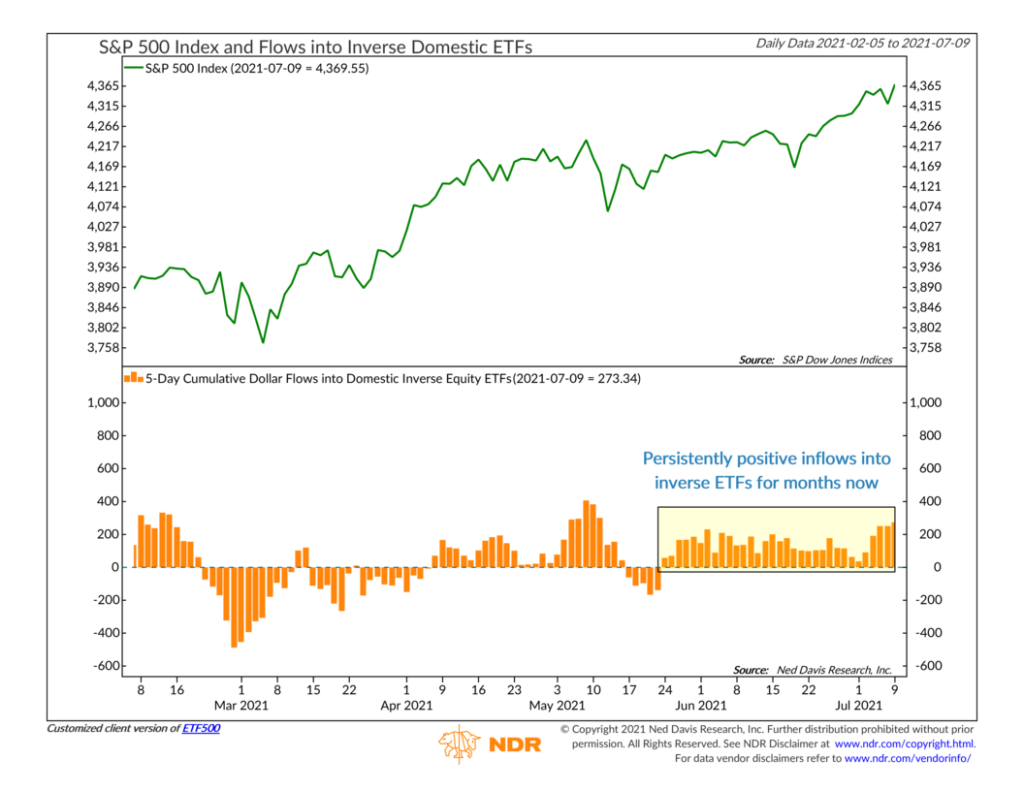
As you can see, investors aren’t trimming their hedges. Flows have been consistently positive for a couple of months now. This runs counter to the survey-based sentiment data. According to the polls, investors are increasingly optimistic about stocks. But it seems they are saying one thing and doing another. While they say they are bullish on stocks, they’re positioning their portfolios as if they were worried about a downturn. We view this as a positive development for stocks, as it’s a sign that complacency is not widespread yet.
This is intended for informational purposes only and should not be used as the primary basis for an investment decision. Consult an advisor for your personal situation.
Indices mentioned are unmanaged, do not incur fees, and cannot be invested into directly.
Past performance does not guarantee future results.
The post No Trimming of Hedges first appeared on NelsonCorp.com.