OVERVIEW
The U.S. stock market had a down week, with the S&P 500 Index falling 0.69%, the Nasdaq Composite dropping 1.57%, and the Dow Jones Industrial Average down just 0.01%.
Foreign stocks, on the other hand, were up for the week. The MSCI EAFE Index of developed country stocks rose 0.21%, and the MSCI EM Index of emerging market stocks increased 0.78%.
Bonds had a good week as the 10-year Treasury yield settled around 3.8%. Intermediate-term Treasuries gained 0.12%, and long-term Treasuries rose 1.6%. Investment-grade corporate bonds gained about 1.24%, and high-yield (junk) bonds rose 0.7%. TIPS, however, fell about 1%.
Real estate was down about 1.7% for the week. Commodities broadly fell about a similar amount. Oil dropped 7.2%, gold fell 0.8%, and corn increased approximately 1%. The U.S. dollar strengthened about by 0.56%.
KEY CONSIDERATIONS
Mixed Sentiment – One of the ways to evaluate sentiment in the stock market is to look at ETF fund flows.
When they’re high, it’s a sign of investor optimism; when they’re low, investors are pessimistic.
Currently, there are several measures of ETF flows signaling extreme investor optimism.
One of them, shown below, shows the 4-week total of ETF equity flows as a percentage of total market capitalization.
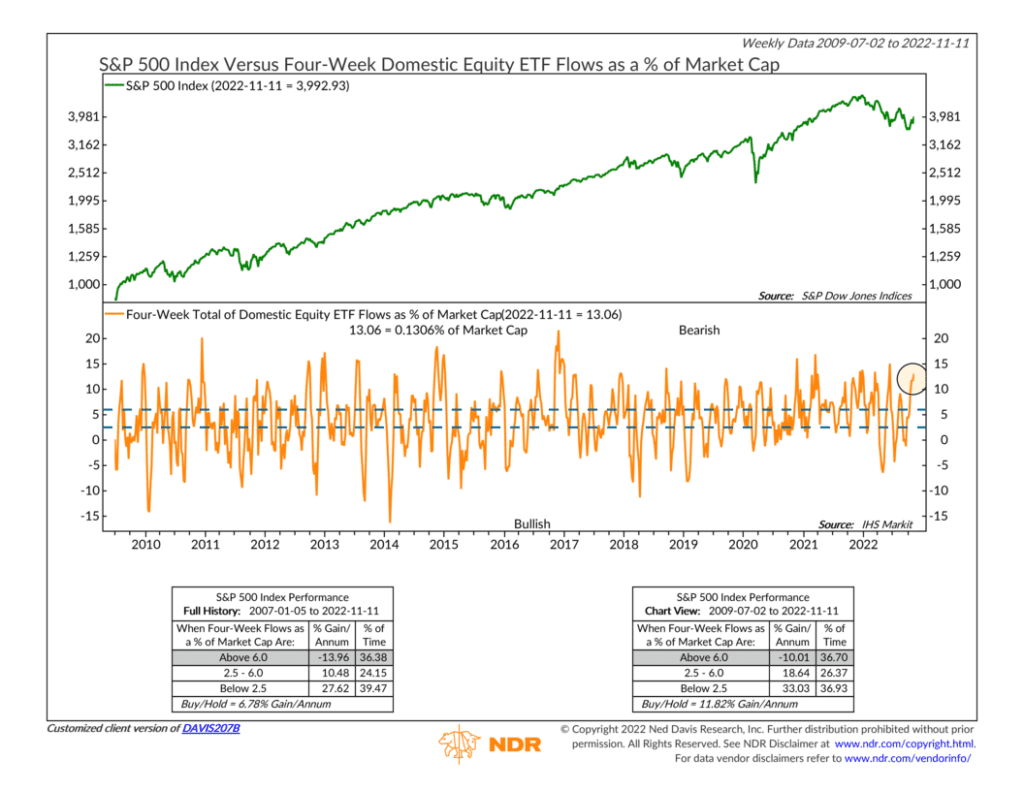
As you can see, they’re near their highest levels of the year. This is a so-called contrarian indicator, so historically, this is a bearish condition for the stock market, with the S&P 500 Index posting negative annualized returns when ETF flows are this high.
On the other hand, however, there are other examples of investor sentiment showing the opposite message—that is, extreme investor pessimism.
For example, the U.S. equity put/call ratio, shown below, recently reached its highest level since 1997. This measures the ratio of bets on falling prices, or “puts,” versus bets on rising prices, known as “calls.” In other words, it measures investor sentiment using options market pricing.
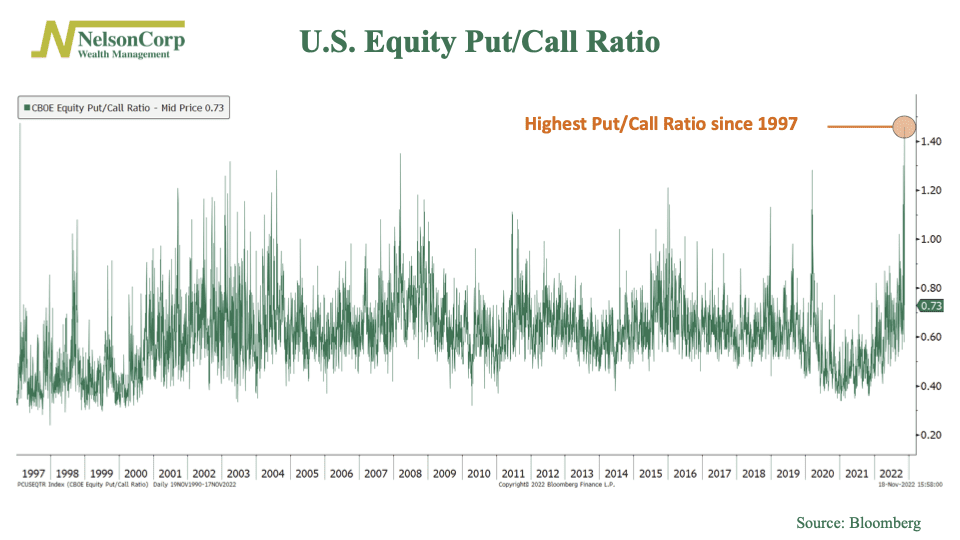
This is important because the put/call ratio is also a contrarian indicator. That means when it hits extreme levels of extreme pessimism—like it recently did—stocks tend to go in the opposite direction.
So, what is sentiment telling us? Well, ETF fund flows are signaling high levels of investor optimism, which is negative for stock prices. But option markets are signaling high levels of investor pessimism, which is positive for stock prices. In other words, it’s a mixed bag right now.
This probably explains a lot of why we saw stocks stall out last week.
After a month-long rally, the S&P 500 seems to be taking a breather here. It’s higher than its average 50-day price but still lower than its average 200-day price.
With the external environment (investor sentiment and economic data) not helping, that leaves the ball in the court of the price action. The bottom line: The stock market will need to prove itself here for us to see any significant model improvement in the near term.
This is intended for informational purposes only and should not be used as the primary basis for an investment decision. Consult an advisor for your personal situation.
Indices mentioned are unmanaged, do not incur fees, and cannot be invested into directly.
Past performance does not guarantee future results.
The post Mixed Sentiment first appeared on NelsonCorp.com.