OVERVIEW
It was a gloomy week for U.S. stocks. The S&P 500 Index sank 2.4%, the Dow Jones Industrial Average dropped 1.6%, and the tech-heavy Nasdaq Composite tumbled 3.16%. The Russell 2000 Index of small-cap stocks also fell around 2.3%.
Volatility rose significantly. The VIX Index—a measure of implied stock market volatility—surged over 10%, reaching its highest level since the regional banking crisis in March.
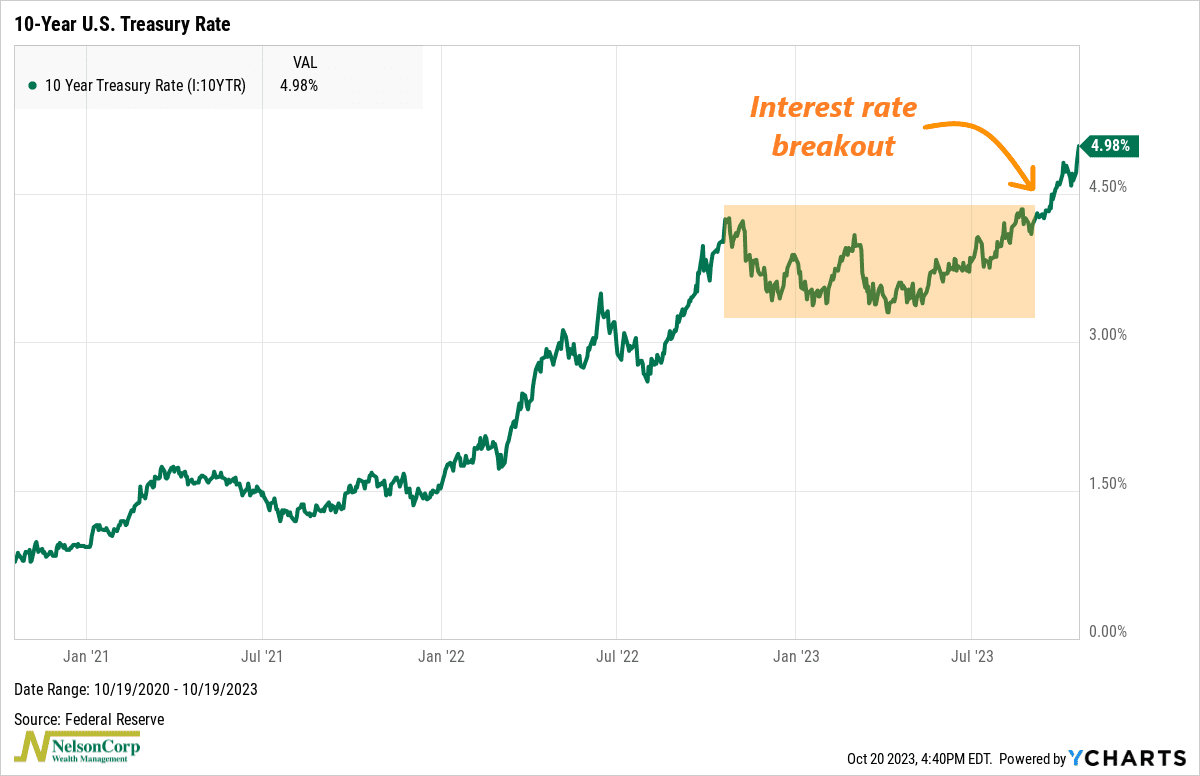
Interest rates drove a lot of this investor angst. The benchmark 10-year Treasury rate effectively reached 5% last week, the highest since before the Great Financial Crisis of ’08. With the 2-year Treasury rate now barely above 5%, the Treasury yield curve is now roughly flat after being deeply inverted for over a year.
Commodities had a good week. Crude oil prices rose to roughly $88/barrel, corn increased about 0.5%, and gold prices surged over 2.5%. This was helped by the U.S. dollar taking a slight breather, down about 0.3% for the week.
KEY CONSIDERATIONS
Mind the Gap – The stock market has been on shaky ground lately. For roughly a month now, the S&P 500 Index has traded each day wedged between its 50- and 200-day moving averages. The two lines get narrower each day—and it feels like something has to give eventually.
For now, the sellers are in control. Two Fridays ago, a “gap” appeared on the S&P 500’s price chart. A gap is just technical jargon for when the price of a security moves sharply up or down, with no trading in between. On a candlestick chart, like the one shown below, it looks like a gap or window.
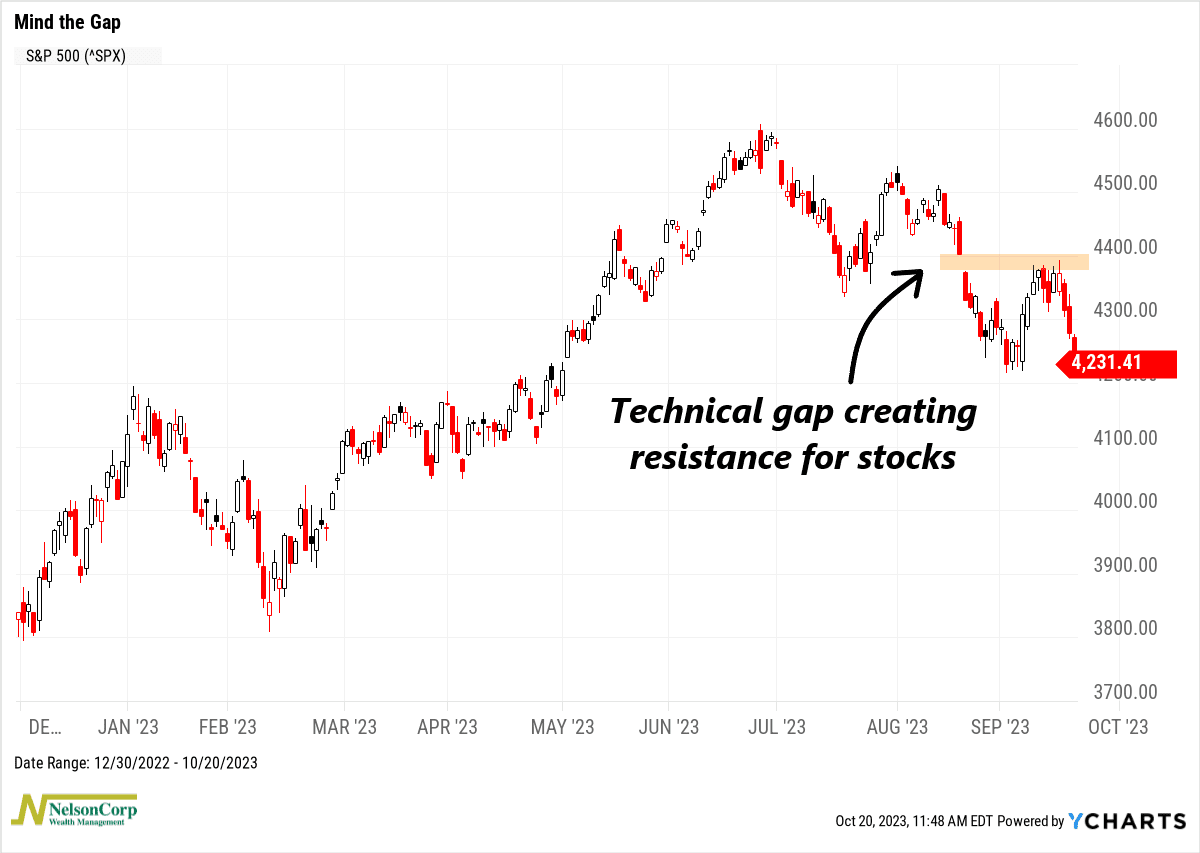
A gap is potentially very important because it can tell us something about the current psychology of market traders. When a gap occurs during a market downturn, like this recent one, it can become a level of future resistance—where sellers step in and drive prices lower whenever buyers push prices close to the gap. In fact, this is exactly what happened last week, as buyers tried and repeatedly failed to break through the gap.
So, what exactly is causing sellers to be so persistent here? One explanation could be what we call the “twin breakouts” or the recent rise in both the U.S. dollar and 10-year U.S. Treasury yields. Each has broken aggressively out of their year-long trading ranges in recent weeks.
Here’s the 10-year U.S. Treasury rate.
And here’s the U.S. Dollar Index.
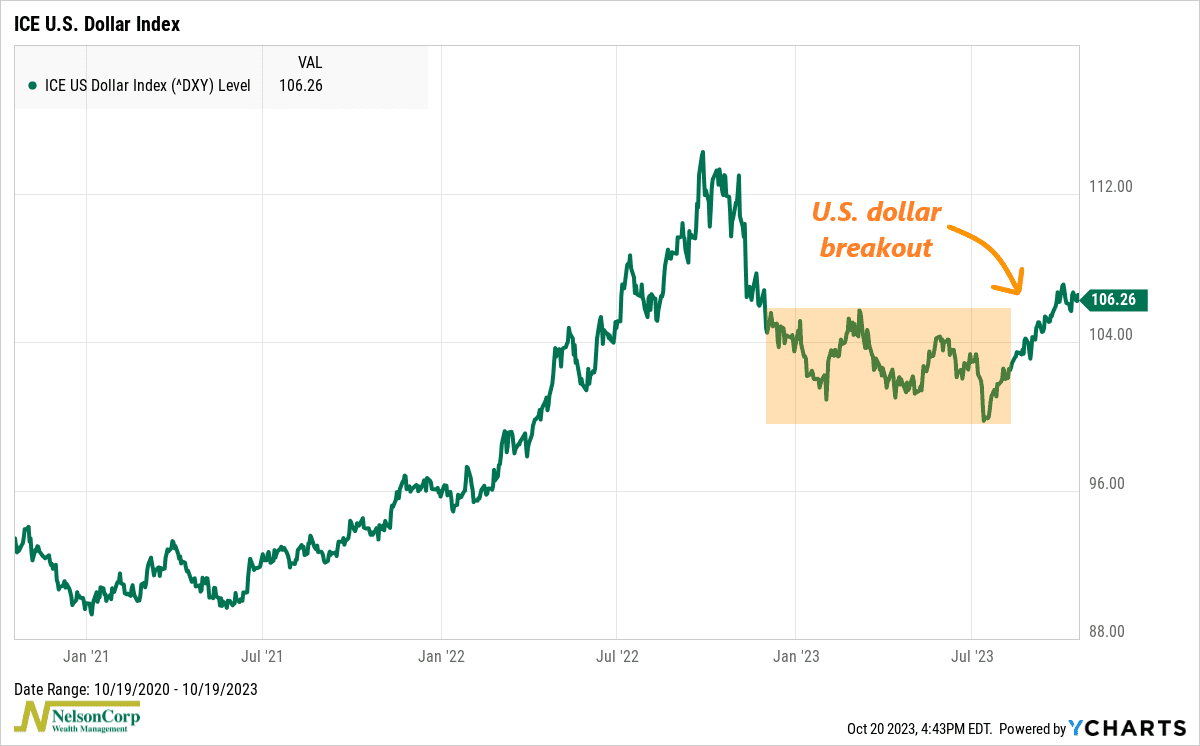
This is a problem because higher interest rates hurt stock prices via increased borrowing costs and higher opportunity costs, meaning stock valuations take a hit. And a stronger U.S. dollar can negatively impact multinational companies—a large chunk of S&P 500 companies—because it makes U.S. exports more expensive for foreign buyers, reducing sales for U.S. companies abroad.
In other words, both the dollar and interest rates are major headwinds for U.S. stocks right now.
But with that said, we are still seeing some positive signs from a few of our indicators, which, for now, has managed to keep our primary stock market risk model barely afloat.
One example is momentum. The model below measures stock market momentum by combining 94 different momentum indicators—encompassing various stock and sector indexes—into one reading that measures daily stock price momentum.
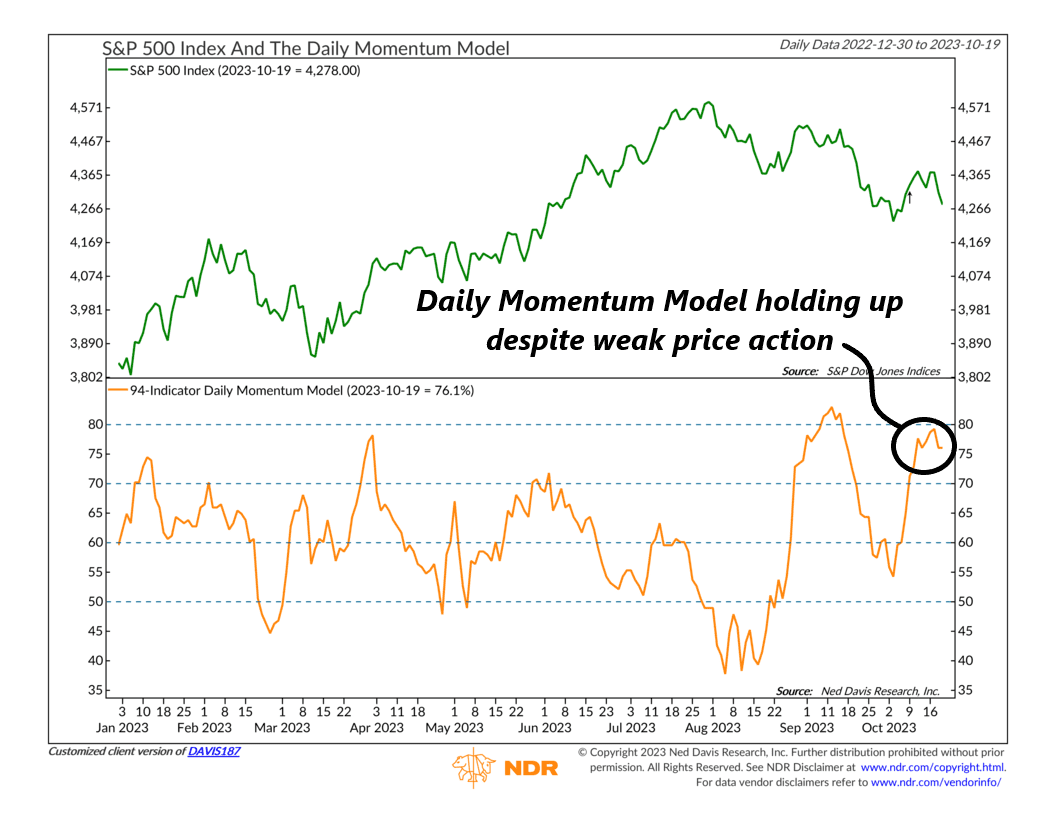
As you can see, although it stumbled at the beginning of the month, it’s back to trading near its highest levels of the year. It also recently triggered a buy signal when it climbed above 70%.
In other words, this model implies that the underlying momentum of the market might be more favorable than the top-level price action suggests.
Another potentially positive sign is that we’ve seen investors position themselves in a way that suggests they are very pessimistic toward stocks. This could be bullish because, historically, whenever the crowd leans too far in one direction, it’s often wrong.
For example, the chart below measures the four-week total sum of money flowing into equity funds.
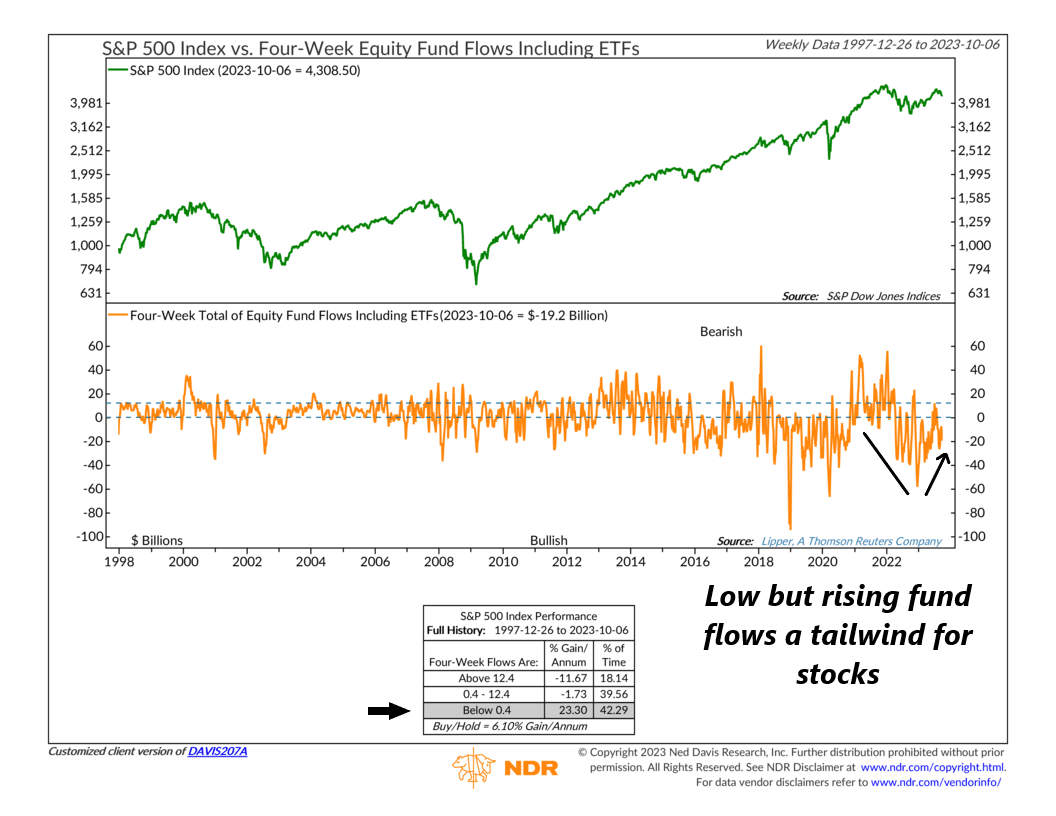
You can see how there was a downward trend in flows from extremely high (bearish) levels that eventually bottomed out at the end of 2022.
Since then, flows have trended higher from extremely low (bullish) levels. With flows still negative at this time, it could be a factor that helps stem the recent tide of stock market selling.
The bottom line, however, is that the technical evidence remains tenuous at best. We’ve seen some recent improvements in momentum, but there still appears to be a cohort of sellers in the market intent on driving prices lower. Much of this is likely due to monetary policy uncertainty, as evidenced by the “twin breakouts” of the U.S. dollar and longer-term interest rates. Ultimately, we’d like to see interest rates stabilize soon to improve the chances that we see a year-end rally in risk assets.
This is intended for informational purposes only and should not be used as the primary basis for an investment decision. Consult an advisor for your personal situation.
Indices mentioned are unmanaged, do not incur fees, and cannot be invested into directly.
Past performance does not guarantee future results.
The S&P 500 Index, or Standard & Poor’s 500 Index, is a market-capitalization-weighted index of 500 leading publicly traded companies in the U.S.
The post Mind the Gap first appeared on NelsonCorp.com.