OVERVIEW
The U.S. stock market stumbled into 2024, with the S&P 500 Index dropping 1.5% last week. The Dow did slightly better, falling just 0.6%, whereas the Nasdaq tumbled 3.3%.
Among U.S. stocks, small-cap stocks performed the worst, experiencing a 3.65% decline. Value stocks, on the other hand, fared better, only down by 0.4%, while growth stocks dipped by 2.8%.
International markets also faced losses, with developed country markets seeing a 1.6% decrease and emerging markets falling by 1.5%.
Bonds had a challenging week, as the 10-year Treasury rate rose back above 4%. Overall, U.S. bond prices fell by around 1%, with longer-dated Treasury bonds experiencing a more significant drop of over 2.5%.
On a positive note, commodities showed a slight uptick, rising broadly by about 0.6%. Oil led the way with a notable gain of 3.6% for the week. Gold, however, saw a dip of nearly 1%. Additionally, the U.S. dollar strengthened by about 1.2%.
KEY CONSIDERATIONS
Lump of Coal – The 2024 trading year is underway. So far, it’s been underwhelming. Apparently, Santa decided Wall Street was on the naughty list this year—and left a lump of coal in investors’ stockings.
The so-called Santa Claus Rally, where the stock market tends to rise during the Christmas season, was a dud. As the chart below shows, the last 5 trading days of 2023 and the first 2 trading days of 2024 saw a cumulative decline of about 0.88% for the S&P 500 Index. Usually (about 80% of the time), that period sees an average gain of 1.4%.
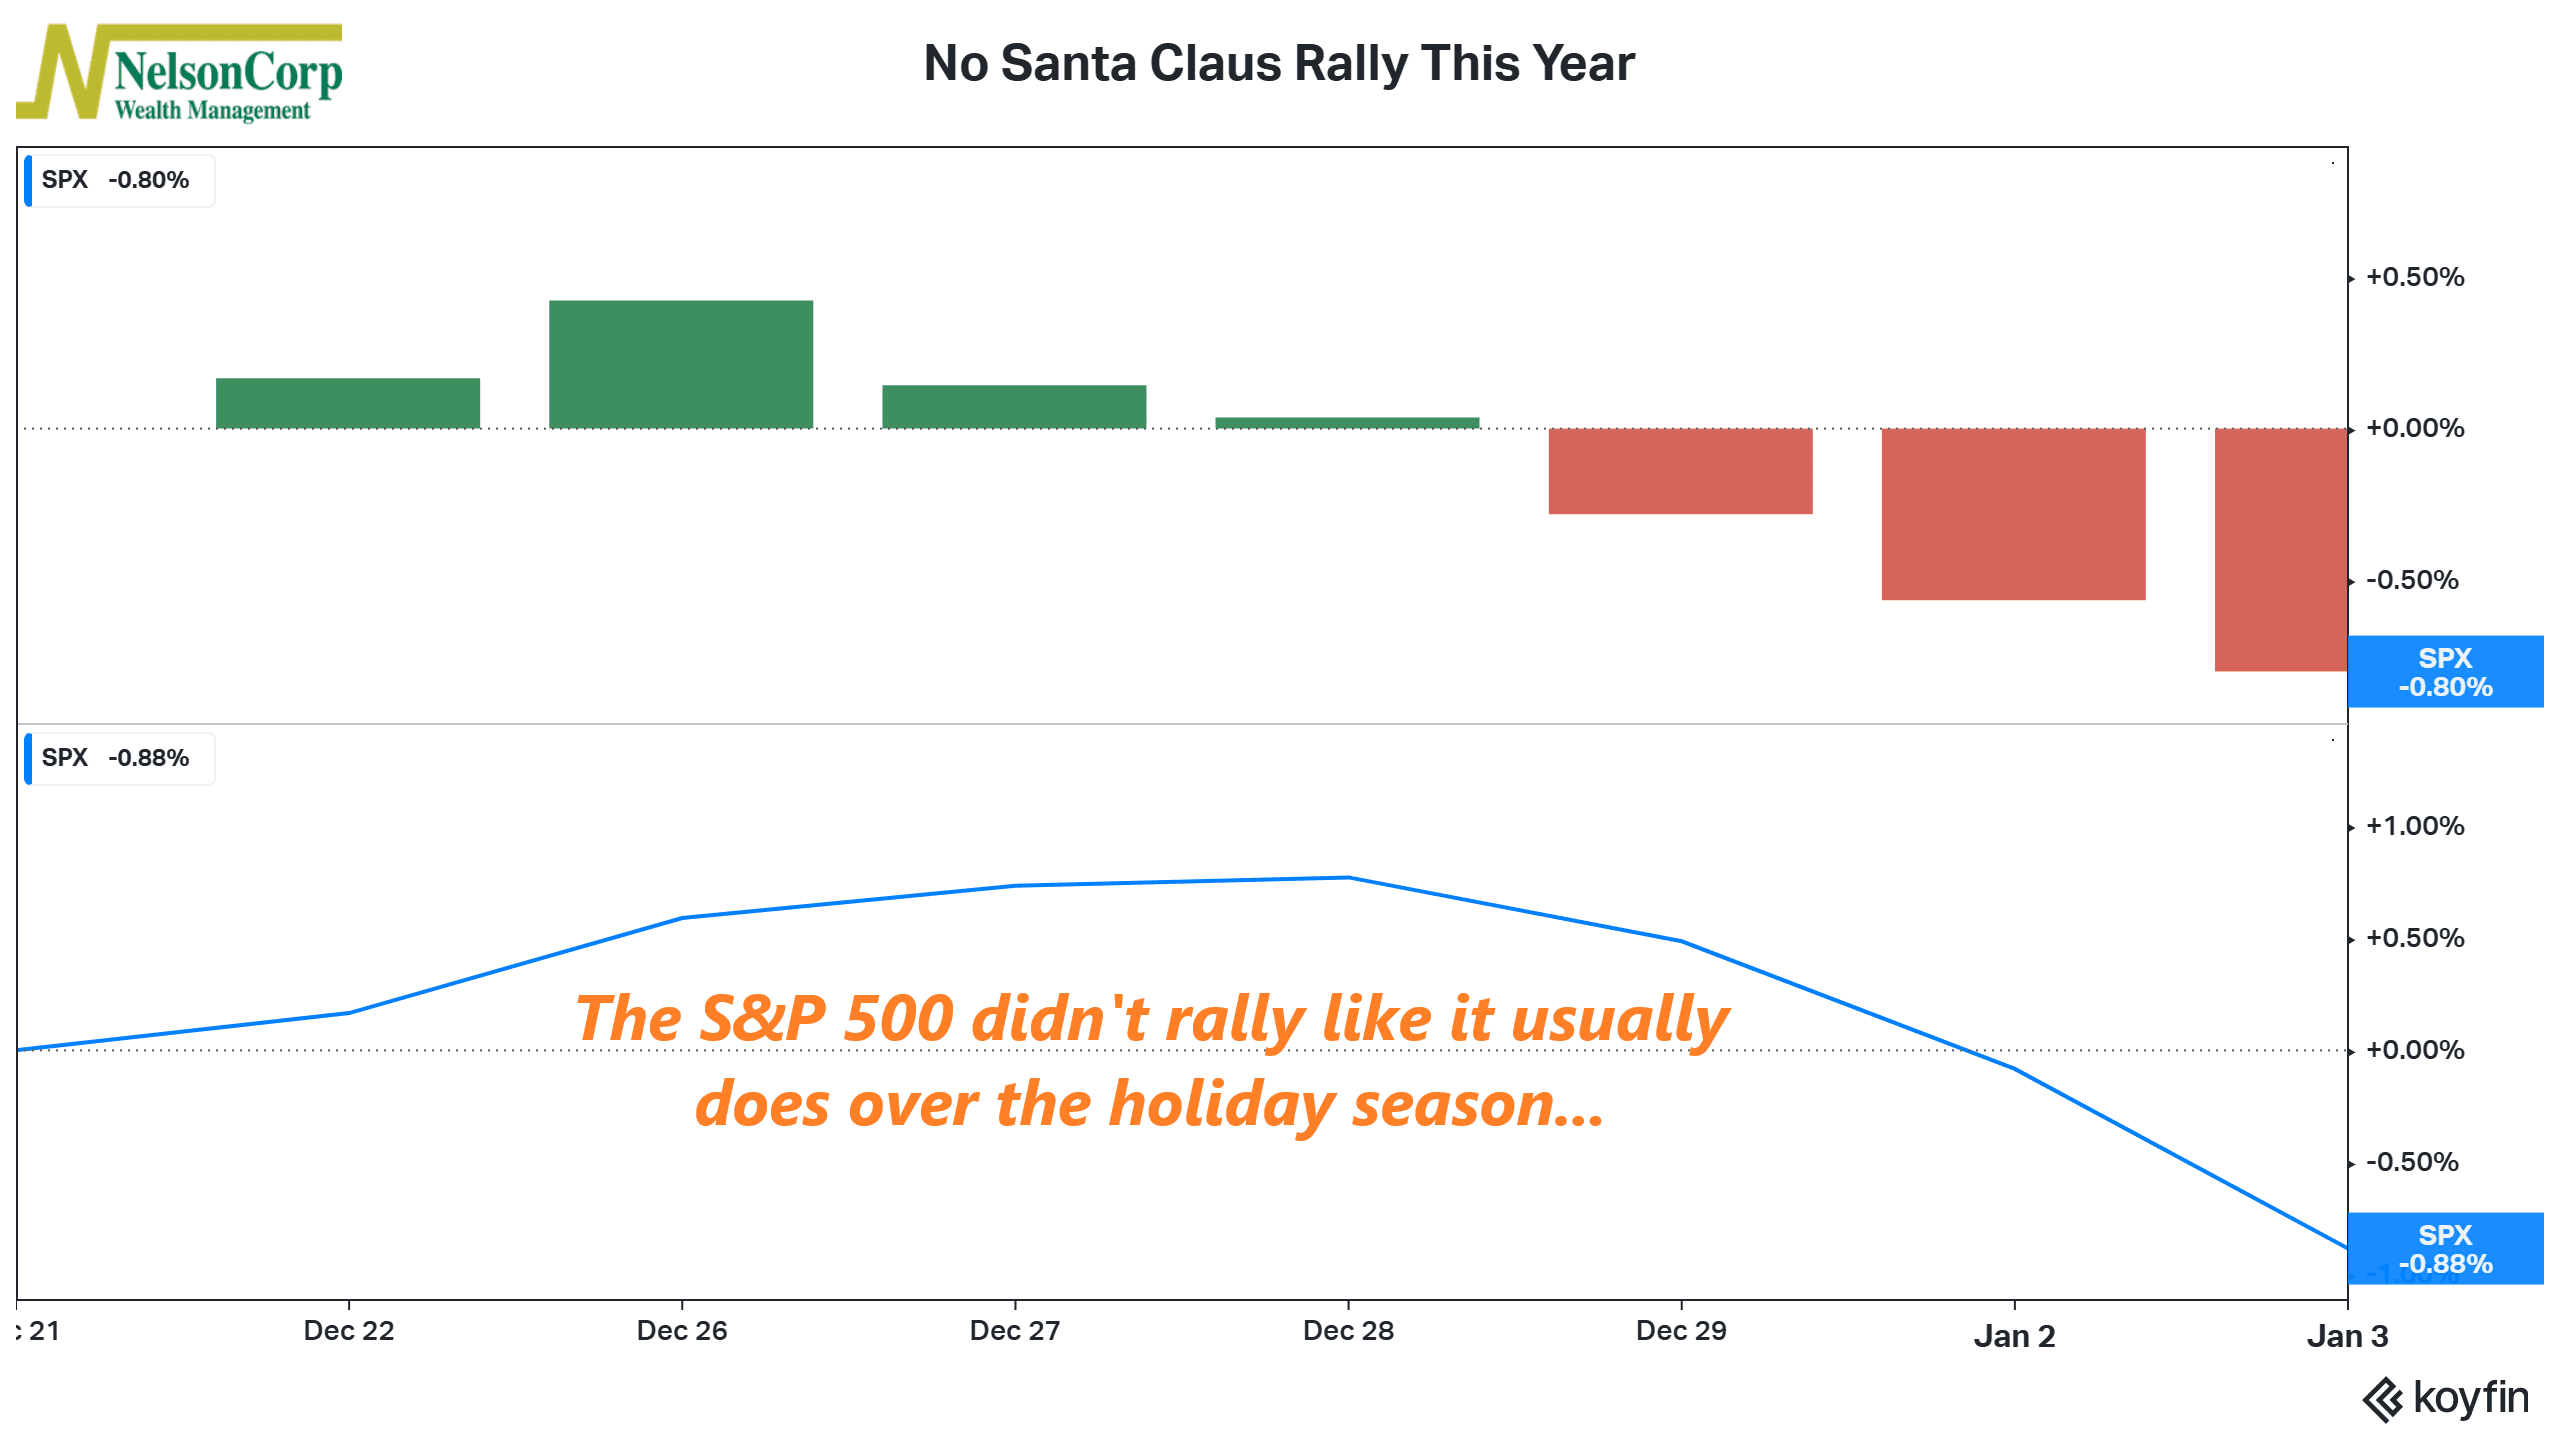
Does this mean it’s all over for the stock market this year? No. Absolutely not. But it is worth noting that the past 5 years in a row in which Santa didn’t visit Wall Street, the month of January saw negative returns. And as the old market adage says, as goes January, so goes the year.
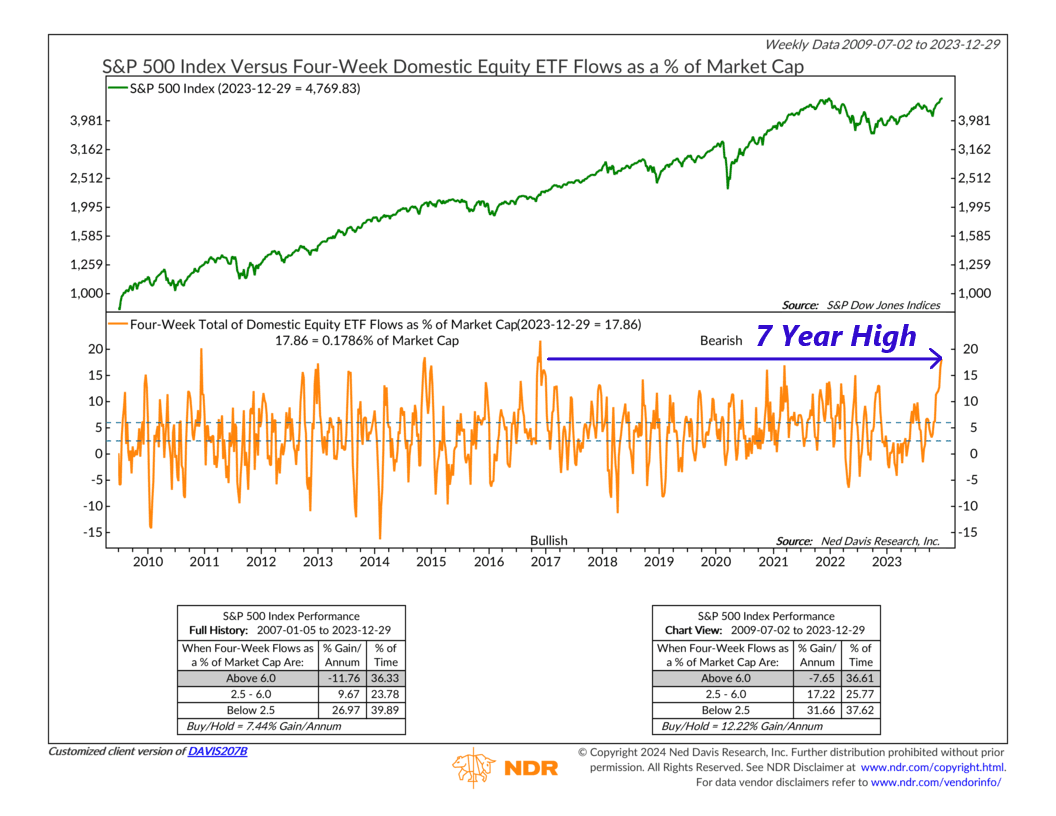
Now, to be fair, stocks did have a pretty strong rally to end the year. In fact, most of the S&P 500’s gain last year came within the past few months of the year. That generated a lot of optimism among investors, which, historically, tends to create resistance for stock prices going forward.
For example, the chart below shows that the money flowing into stock ETFs (as a percentage of market cap) is at a 7-year high. As the performance box on the bottom of the chart reveals, the S&P 500 tends to struggle when fund flows are this high—with the index generating an average loss of nearly 12% annualized.
With all that said, however, there is one bright spot to consider: financial conditions. Financial conditions refer to how easily money and credit flow through the economy. And according to a Bloomberg measure (shown below), U.S. financial conditions are currently the best they’ve been in almost two years.
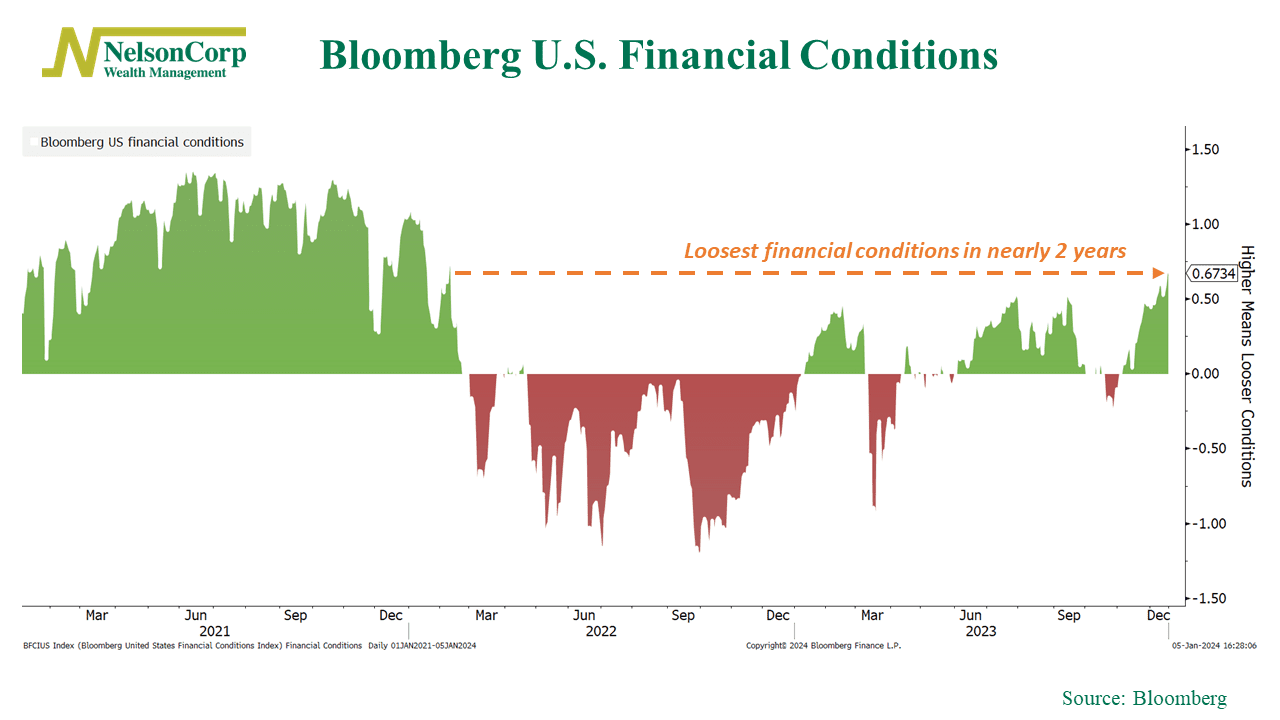
The bottom line? We still view the external market environment—financial conditions included—as being slightly bullish for stocks. This could help support the stock market going forward, assuming the market’s long-term uptrend remains intact and sentiment doesn’t get too lopsided.
This is intended for informational purposes only and should not be used as the primary basis for an investment decision. Consult an advisor for your personal situation.
Indices mentioned are unmanaged, do not incur fees, and cannot be invested into directly.
Past performance does not guarantee future results.
The S&P 500 Index, or Standard & Poor’s 500 Index, is a market-capitalization-weighted index of 500 leading publicly traded companies in the U.S.
The post Lump of Coal first appeared on NelsonCorp.com.