OVERVIEW
U.S. stocks continued their winning streak for the eighth consecutive week, marking the longest stretch of gains since November 2017 for the S&P 500 Index. The index saw a 0.75% increase for the week. The Dow rose by 0.22%, and the Nasdaq experienced a 1.21% increase. Small caps outperformed, with the Russell 2000 gaining an impressive 2.25%.
In contrast, foreign stocks had a mixed performance. Developed country stocks showed a 1.43% increase while emerging markets saw a decline of 0.56%.
Bonds experienced moderate price gains as the 10-year Treasury yield dropped to 3.89%. Intermediate-term Treasuries rose by approximately 0.2%, while long-dated Treasuries (20+ years) fell by around 0.7%.
Commodities as a whole saw a broad increase of about 0.25%, driven by a 2.3% gain in oil prices and a 1.75% increase in gold. Real estate, however, faced a decline of about 0.65%, and the U.S. dollar weakened by over 1%.
KEY CONSIDERATIONS
Jolly Markets – Falling inflation continues to put the stock market in a jolly mood.
Last Friday, we found out that the Fed’s preferred inflation gauge—the personal consumption expenditures price index—fell 0.1% in November from the previous month, the first decline since April 2020.
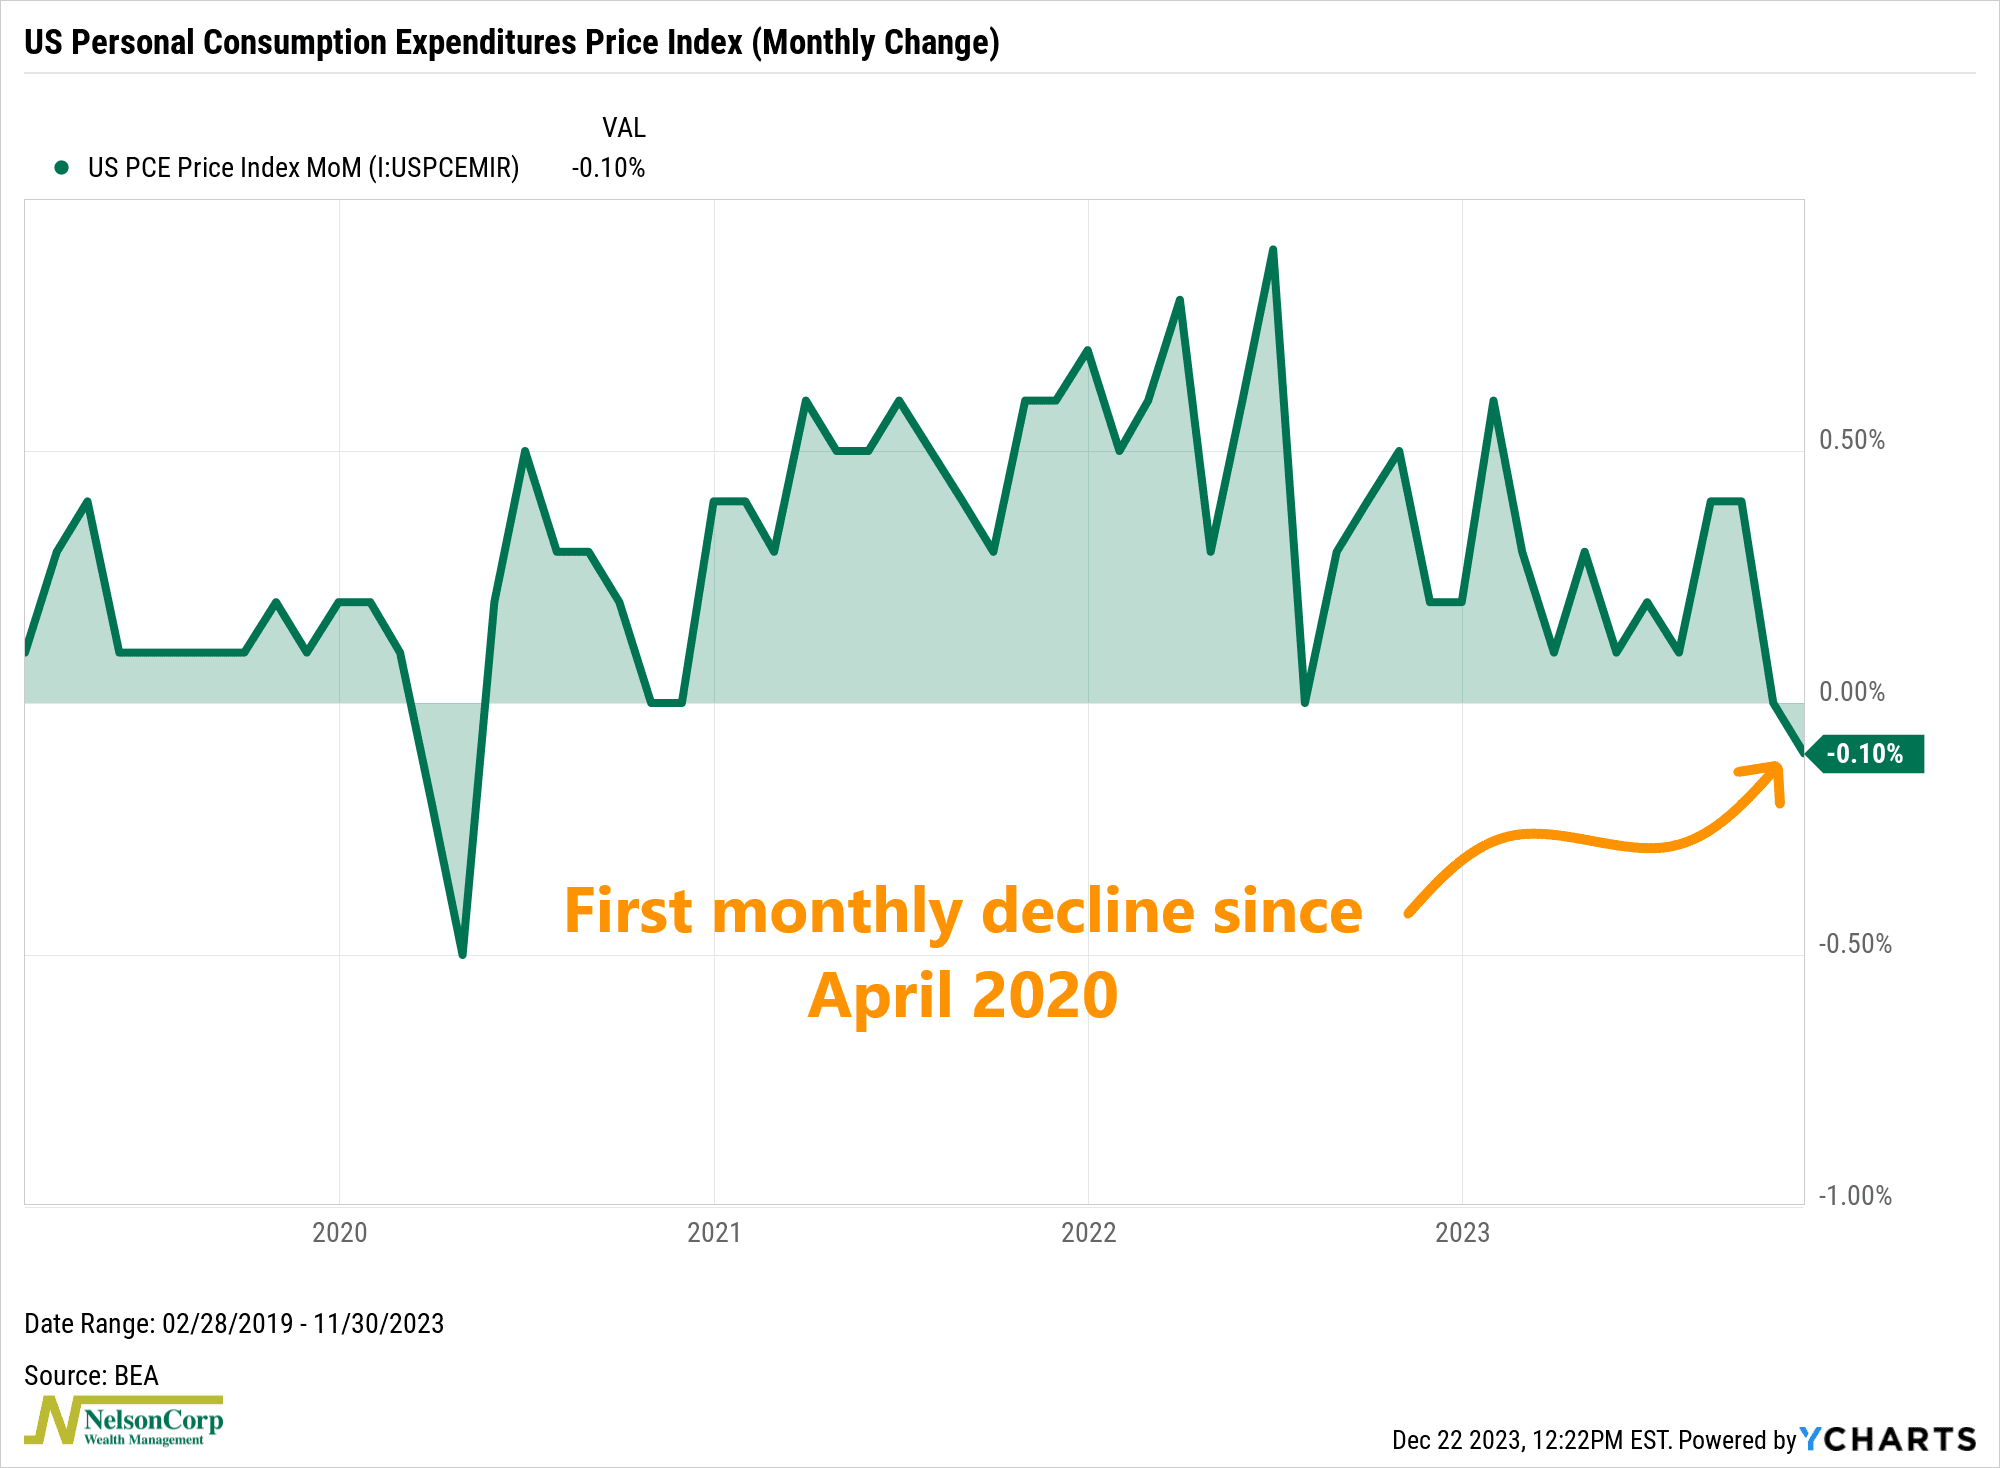
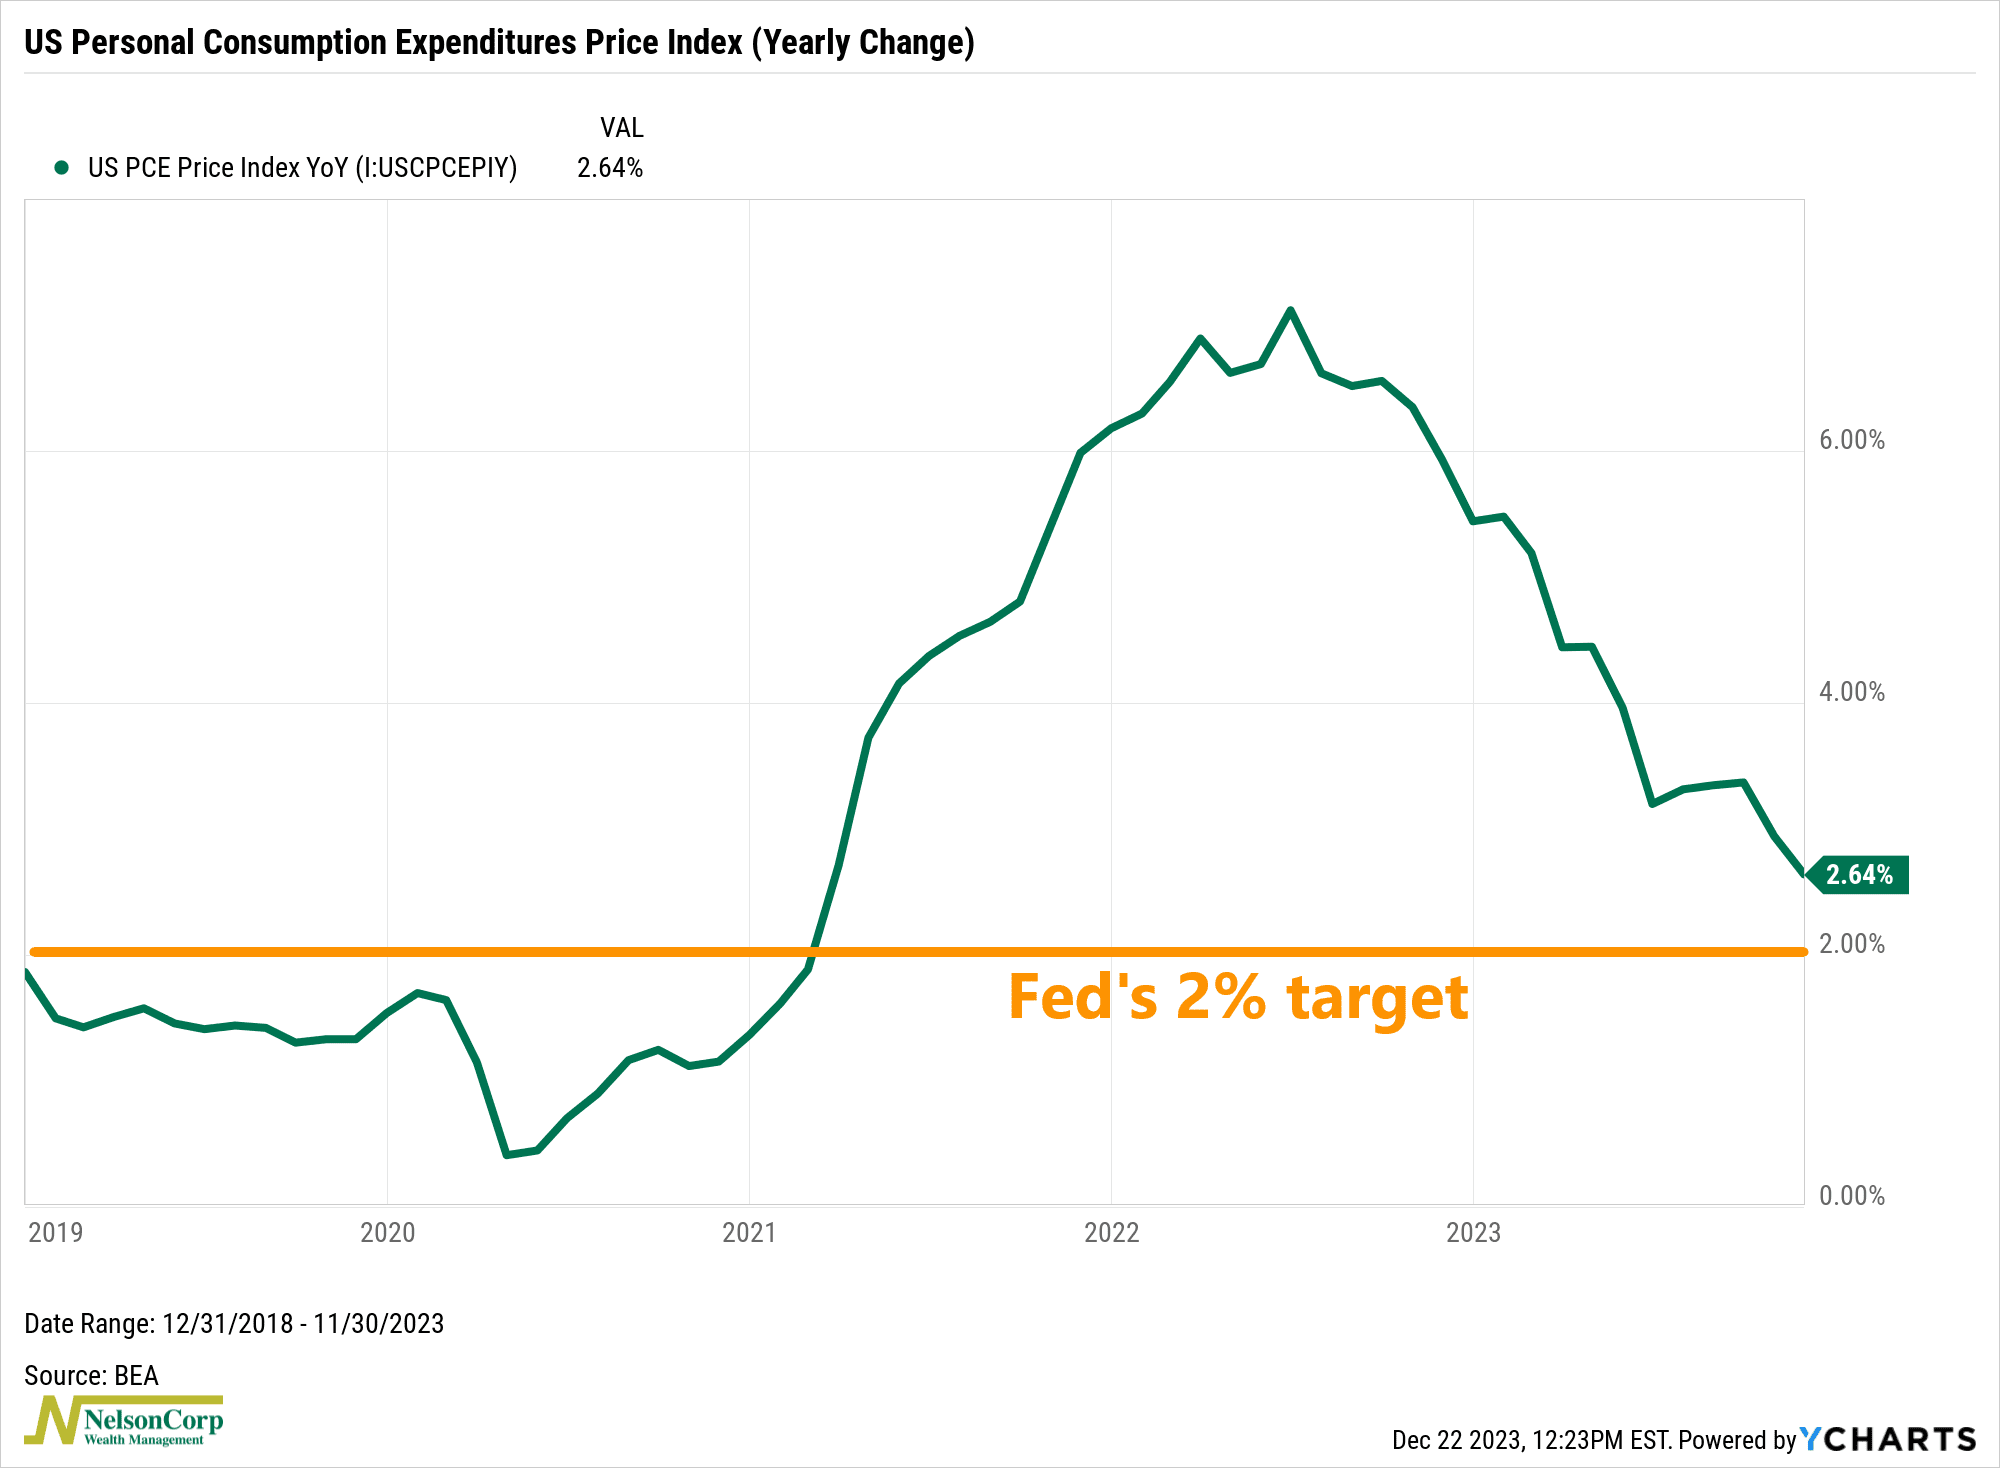
On a year-over-year basis, that amounted to just 2.6%. The Fed targets an annualized rate of 2%, so it appears we are well on our way to reaching that target in the coming months.
The markets love it. If we look at the ratio of high beta stocks to low volatility stocks, shown on the chart below, we see that it is nearing all-time highs.
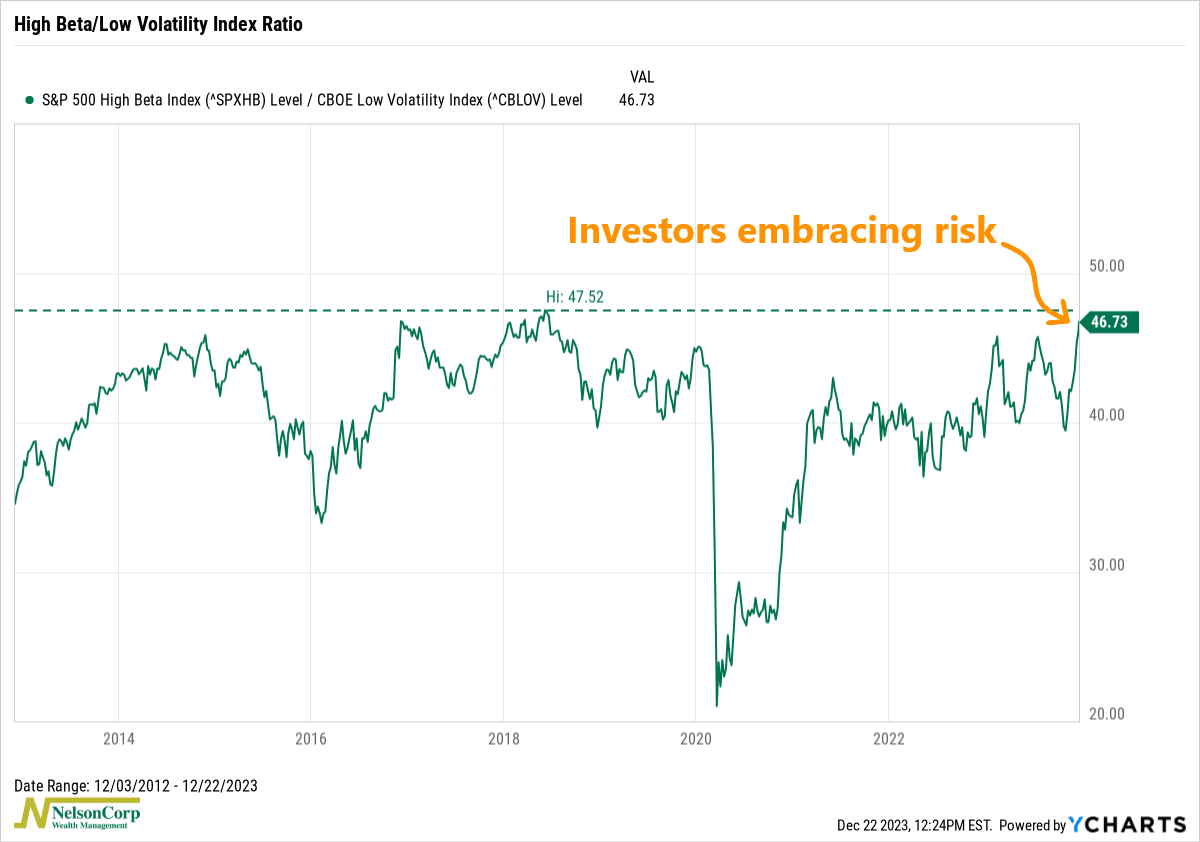
In other words, investors are embracing risk by bidding up the prices of stocks that tend to have higher volatility or risk (high beta) relative to the stocks that are less risky (low volatility).
This embrace of risk is also showing up in some of our thrust indicators. The indicator below takes the 2-day average price of the Value Line Geometric Index and divides it by its 16-day average price (scaled to 100). When this measure climbs above 102 (the upper dashed line), it’s a sign of intense price action to the upside, or what we call a “thrust.”
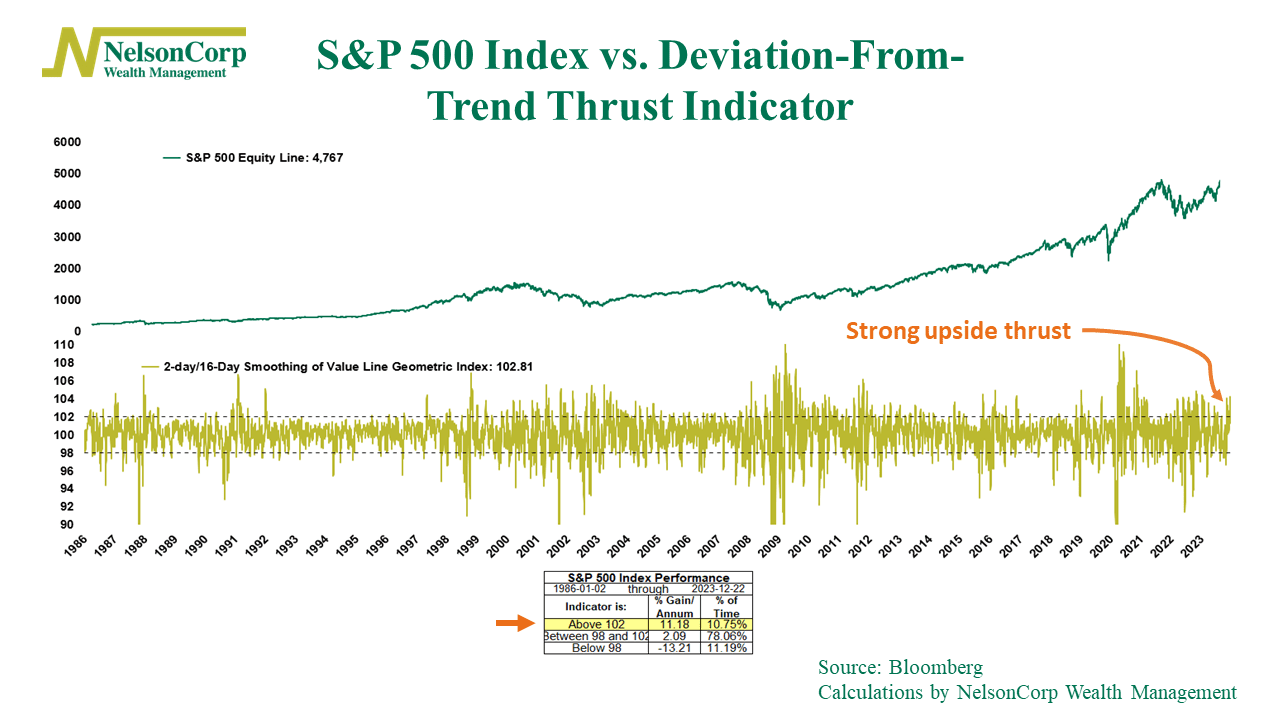
Historically, the S&P 500 Index does well after one of these positive thrust signals, returning more than 11% per annum, on average. Typically, this also tends to equate to an average gain of roughly 6% over the subsequent three months.
In other words, sometimes the stock market is like a rabbit. It sits still for long stretches of time before suddenly hopping away. The price action over the past couple of months certainly feels like that.
I’ll end with one more fun little chart that shows why consumers are likely in a jolly mood this holiday season. This chart divides the price of the S&P 500 Index by the price of a gallon of gasoline. In other words, it shows how many gallons of gas you can buy in exchange for one hypothetical “share” of the S&P 500 Index.
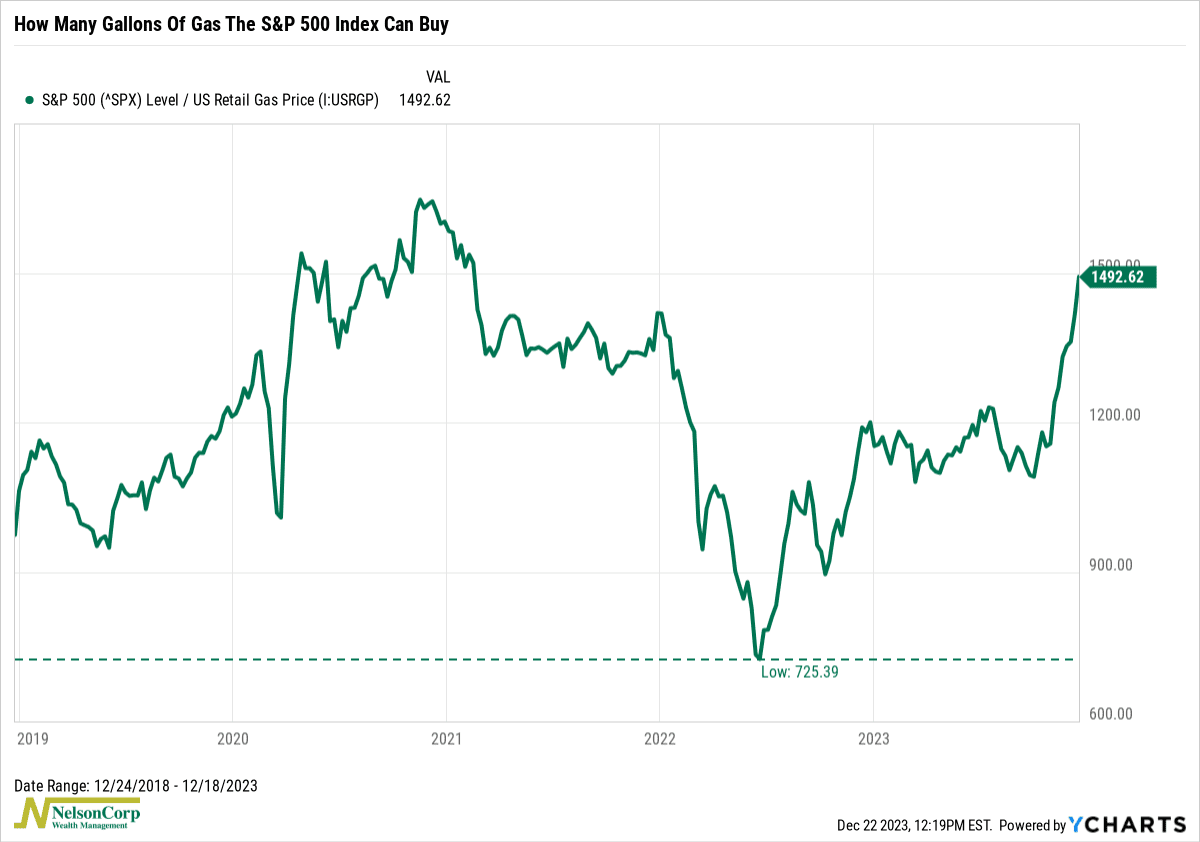
In the summer of 2022, it fell to about 725. Today, you can get nearly 1,500 gallons of gas for one “share” of the S&P 500. That probably helps with consumer sentiment quite a bit.
This is intended for informational purposes only and should not be used as the primary basis for an investment decision.
Consult an advisor for your personal situation.
Indices mentioned are unmanaged, do not incur fees, and cannot be invested into directly.
Past performance does not guarantee future results.
The S&P 500 Index, or Standard & Poor’s 500 Index, is a market-capitalization-weighted index of 500 leading publicly traded companies in the U.S.
The post Jolly Markets first appeared on NelsonCorp.com.