OVERVIEW
U.S. stocks took a step backward last week as the S&P 500 Index fell 1.4%, breaking its five-week streak of gains. The Dow also fell, around 1.67%, and the Nasdaq declined around 1.44%.
Foreign stocks performed worse, with developed countries down 3.37% and emerging markets decreasing 3.7%.
Bonds, on the other hand, saw slightly positive gains as the yield on the 10-year Treasury declined to 3.74%. Short-term Treasuries rose 0.08%, intermediate-term Treasuries increased 0.18%, and long-term Treasuries gained 0.62%. While investment-grade corporate bonds also rose around 0.14%, high-yield bonds fell around 0.75%.
Real estate had a rough week, down 4.52%. Commodities also fell around 2.66% broadly. Oil led the decline, down 3%, while gold fell 2.11% and corn decreased 1.56%. The U.S. dollar strengthened against the world’s major currencies to the tune of about 0.7%.
KEY CONSIDERATIONS
Is There Enough Demand to Sustain Momentum?- The U.S. stock market ran into some weakness last week, with the S&P 500 Index breaking its five-week winning streak.
But, overall, the surge in prices over the past month has been pretty strong. Technically, the stock market has what we call positive momentum.
This is clearly seen in a famous technical indicator called the Relative Strength Index (RSI), shown below.
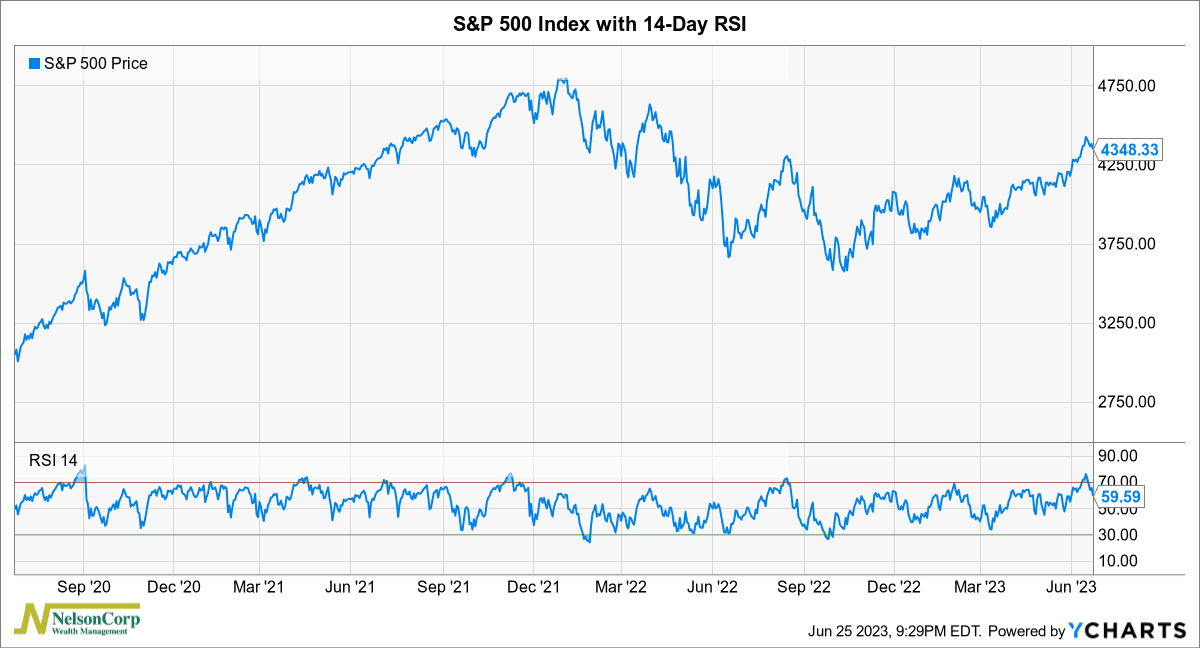
It recently rose to nearly 77%, the highest reading since September 2020.
There are a couple of ways of interpreting this.
On the one hand, the RSI is a momentum indicator, so readings above 70% are considered bullish. Mathematically, it’s a sign that the market has been going up (which it has) and will likely continue going up for some time.
But on the other hand, the RSI is an oscillating indicator, meaning that when it’s high, it has a strong tendency to fall, and when it’s low, it has a strong tendency to rise. In other words, the RSI tends to revert to its long-run average value over time—which, historically, has been a little over 50%.
So, by this logic, a reading over 70% is a sign of an overbought stock market. For the RSI to revert to its long-run average of 53% or so, the S&P 500 will need to go down. Quick math says that for the RSI to drop to its average, it will require a 5% drop in the S&P 500. Of course, the S&P 500 could keep rising from here, but the higher the RSI gets, the larger the decline that follows.
As you can see on the chart, some of that decline has already happened. Last week’s decline in the S&P 500 dropped the RSI back to about 60%.
To add some perspective on how we see things, I have another indicator, shown below, that measures volume supply and demand in the stock market.
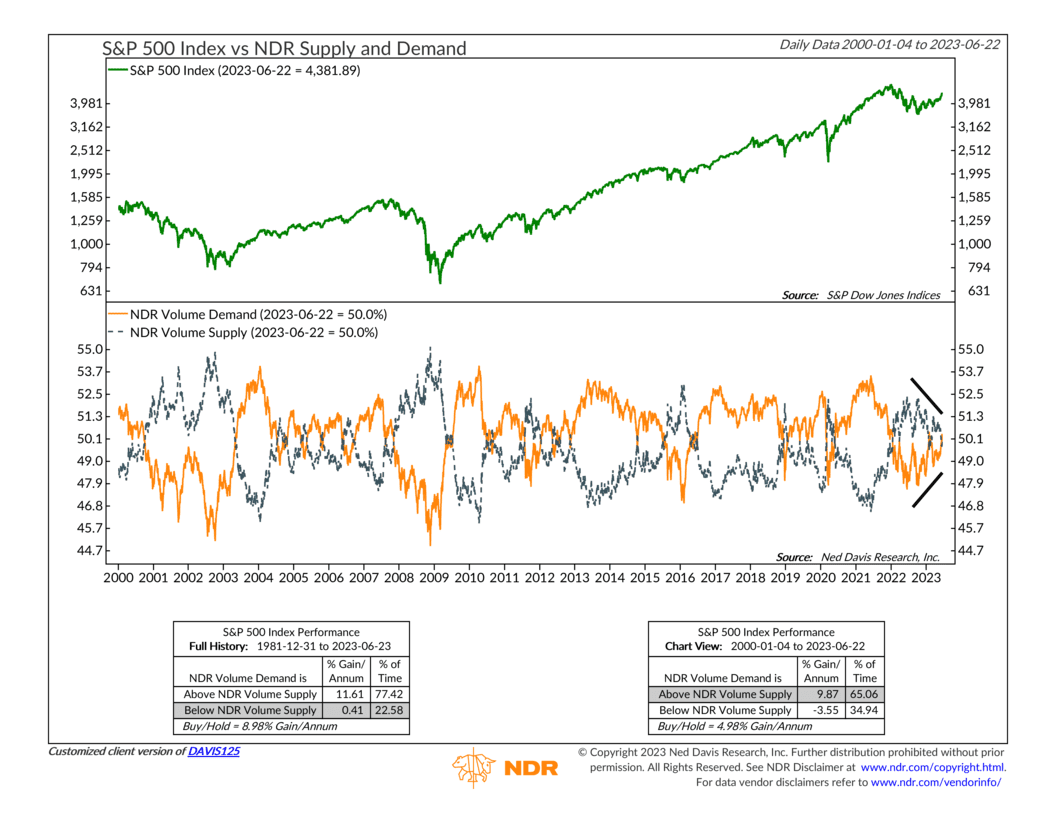
Historically, volume demand rising above supply has been a bullish condition for stocks. This happened just barely recently. But more significantly, since June 2022, volume supply has been trending downwards while volume demand has been trending upwards. Going forward, if volume demand can consistently outrun volume supply, it would be the sort of tailwind needed to keep the stock market’s momentum positive.
So, the bottom line is that the stock market has exhibited very strong momentum recently, but the nature of this strength has led to what might be considered overbought conditions. Due to the mathematics of the RSI, we shouldn’t be surprised to see some weakness in prices going forward. But if volume demand can be sustained, it might help keep the stock market’s momentum going.
This is intended for informational purposes only and should not be used as the primary basis for an investment decision. Consult an advisor for your personal situation.
Indices mentioned are unmanaged, do not incur fees, and cannot be invested into directly.
Past performance does not guarantee future results.
The post Is There Enough Demand to Sustain Momentum? first appeared on NelsonCorp.com.