OVERVIEW
It was a mixed bag for U.S. stocks last week as a late surge on Friday helped push the S&P 500 Index back into positive territory after trading much lower all week.
Ultimately, the S&P 500 rose 0.48%. The Nasdaq did better, rising 1.6%. But the Dow lost 0.3% and is now negative for the year. Small-cap stocks brought up the rear, plummeting more than 2% to end the week.
The bond market struggled. The 10-year Treasury rate climbed to nearly 4.8% last week, up from the previous week’s close of 4.58%. The result was a lot of red across the board for most bonds except short-term Treasuries, which saw a slight gain.
Commodities had a rough week; oil dropped over 8%, and gold dipped more than 1%. Corn, however, registered a nice gain of more than 3%. The U.S. dollar remained essentially flat.
KEY CONSIDERATIONS
Hold the Line – The stock market is in a cranky mood. A late surge on Friday helped keep the index positive for the week. But still, the index has been rapidly approaching its 200-day moving average—a critical technical support level—for a few weeks now.
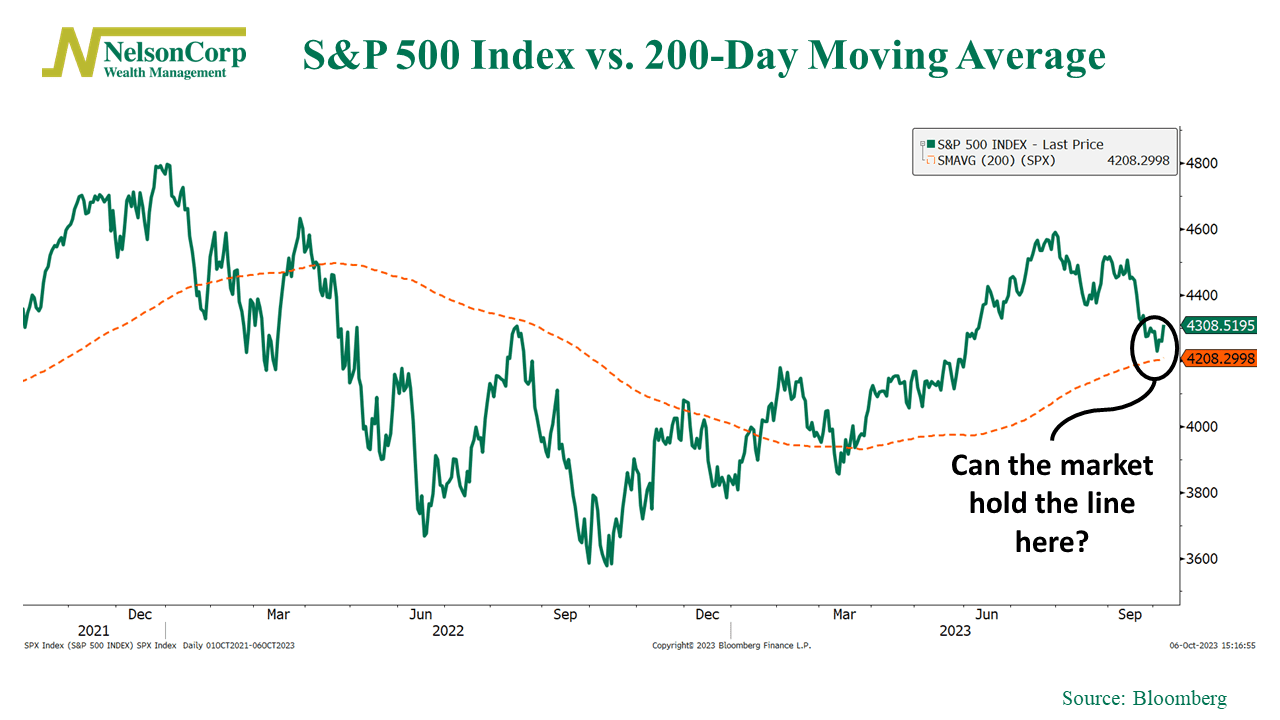
This is where things start to get interesting. A dip below the 200-day moving average tends to be an omen of bad things to come. The index has traded above its 200-day moving average without stopping for six straight months. But now, it’s within spitting distance.
So, what’s got Wall Street in such a grumpy mood?
The culprit, it appears, is an even grumpier bond market. A little over three years ago, the 10-year Treasury rate was just 0.5%. Last week, it reached 4.8%, the highest since 2007.
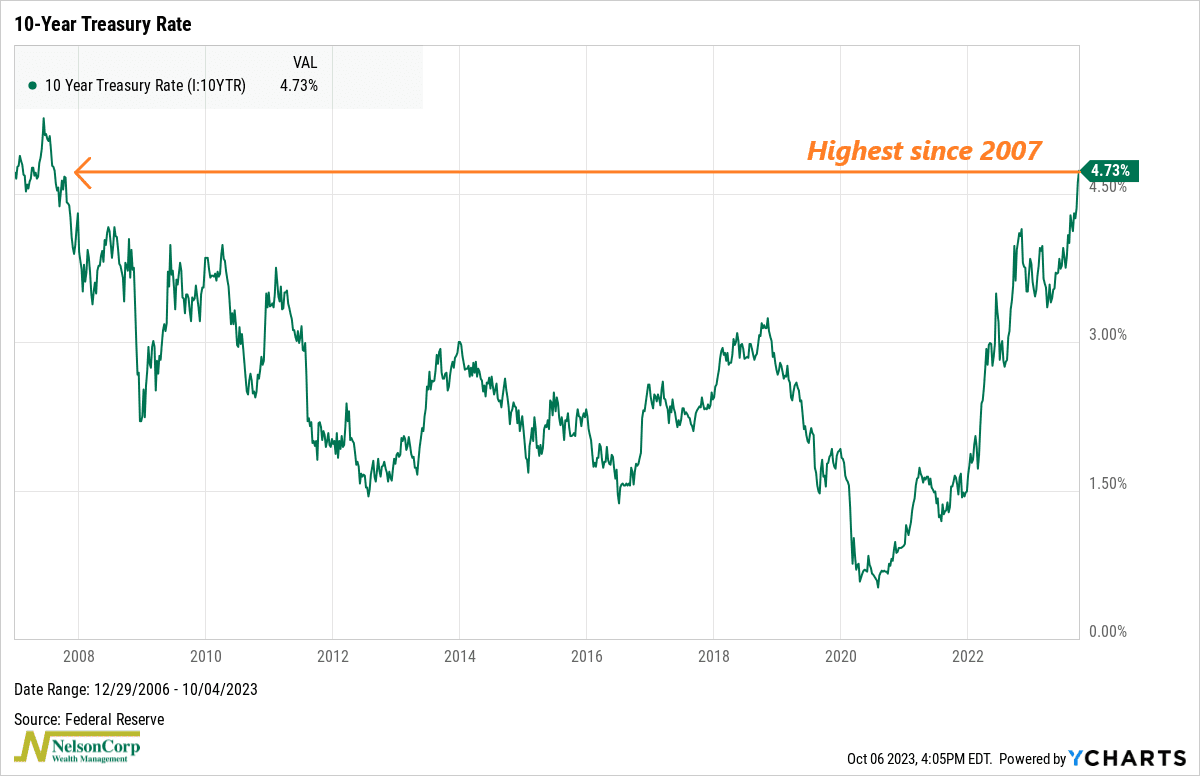
And now, with recent economic data showing a stronger-than-expected economy, the emerging consensus on Wall Street is that the Federal Reserve would like to hold interest rates “higher for longer.”
The stock market doesn’t like that.
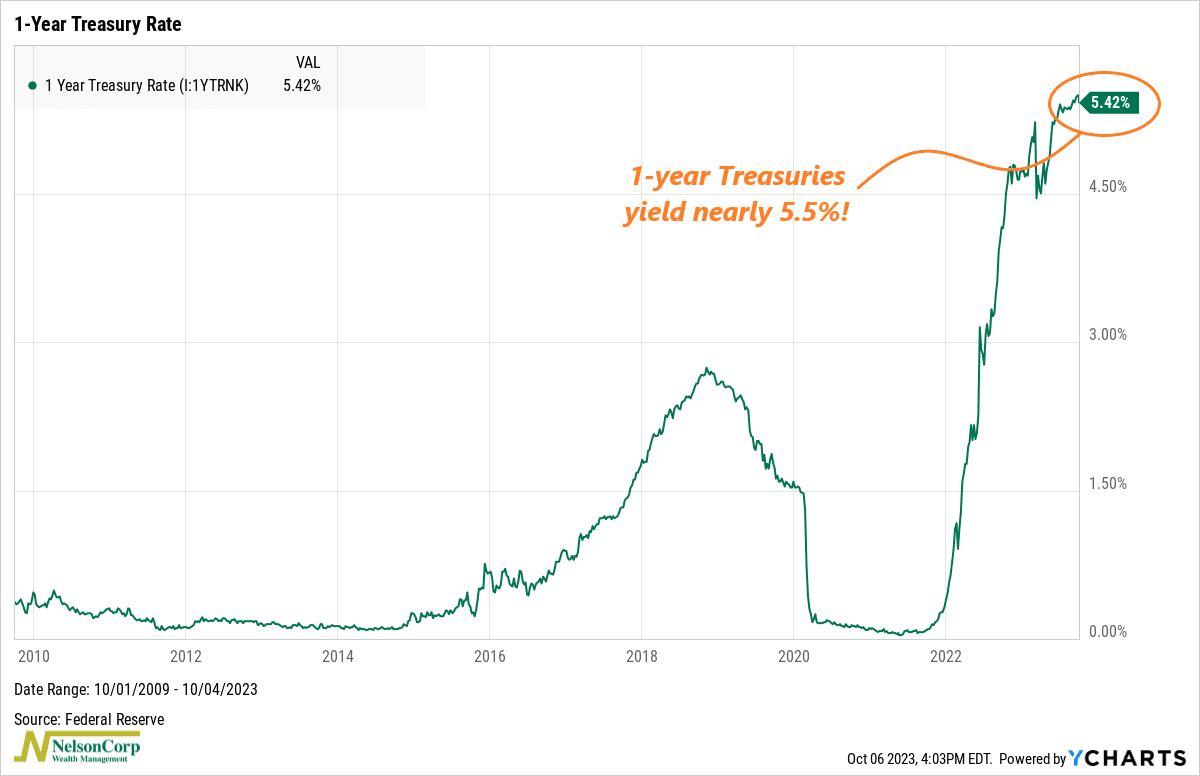
Why? Because it means competition. Higher bond yields mean investors finally have a compelling alternative location to stash their cash.
For example, the 1-year Treasury is currently yielding about 5.5%. It’s not hard to see why investors might prefer making an easy 5.5% for one year versus dealing with the frenzy of the stock market. That 5.5% works out to more than 1,800 Dow points over the coming year—risk-free!
We can also look at this competition issue through the lens of relative valuations. The takeaway here is that, compared to bond yields, stocks just don’t look like a no-brainer slam dunk anymore.
You can see this on the chart below, showing that the S&P 500 earnings yield (inverse price-to-earnings ratio) is now below the 10-year Treasury yield for the first time since 2009.
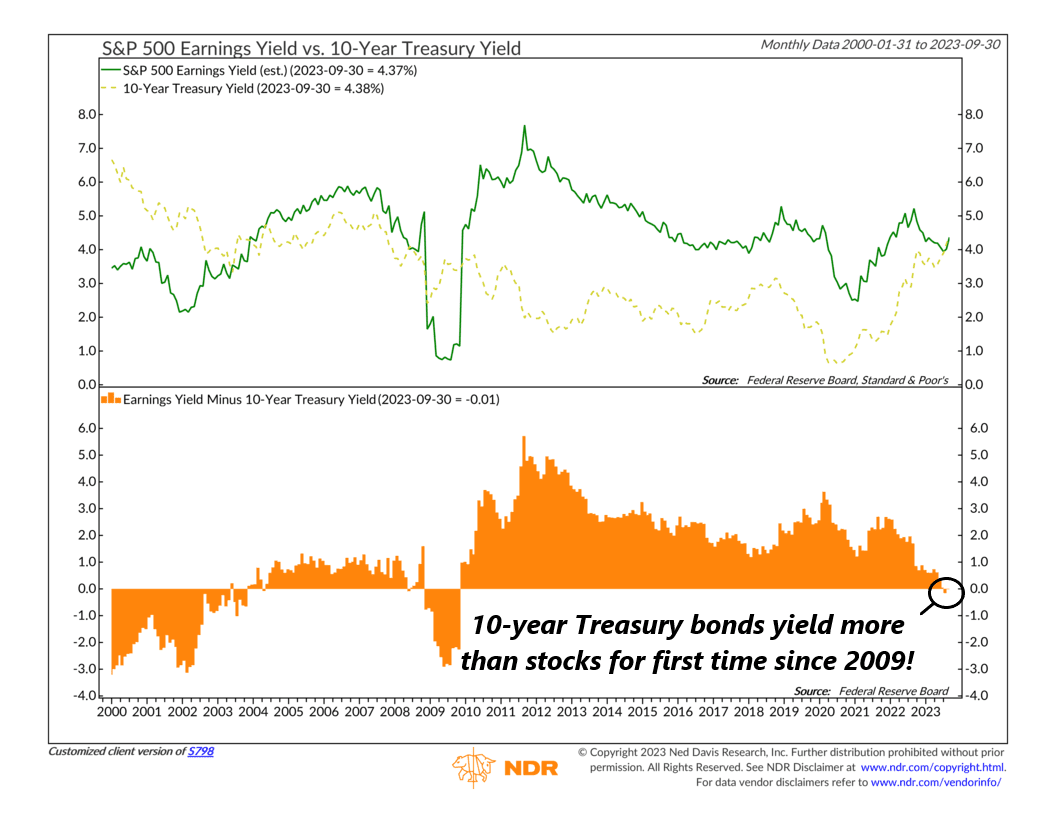
In other words, for the entire 15-year period after the Great Financial Crisis of 2008, stocks were considered “cheap” relative to bonds. Today, however, that no longer appears to be the case.
With all that said, however, I will note that it’s not all bad out there. We haven’t exactly seen the typical “flight to safety” trade within stocks that we usually see during major market selloffs.
For example, the chart below shows that the S&P 500 Equal Weight Consumer Discretionary Index vs. S&P 500 Equal Weight Consumer Staples ratio is still in an uptrend, indicating that the average stock in the consumer discretionary sector is outperforming the average stock in the consumer staples sector.
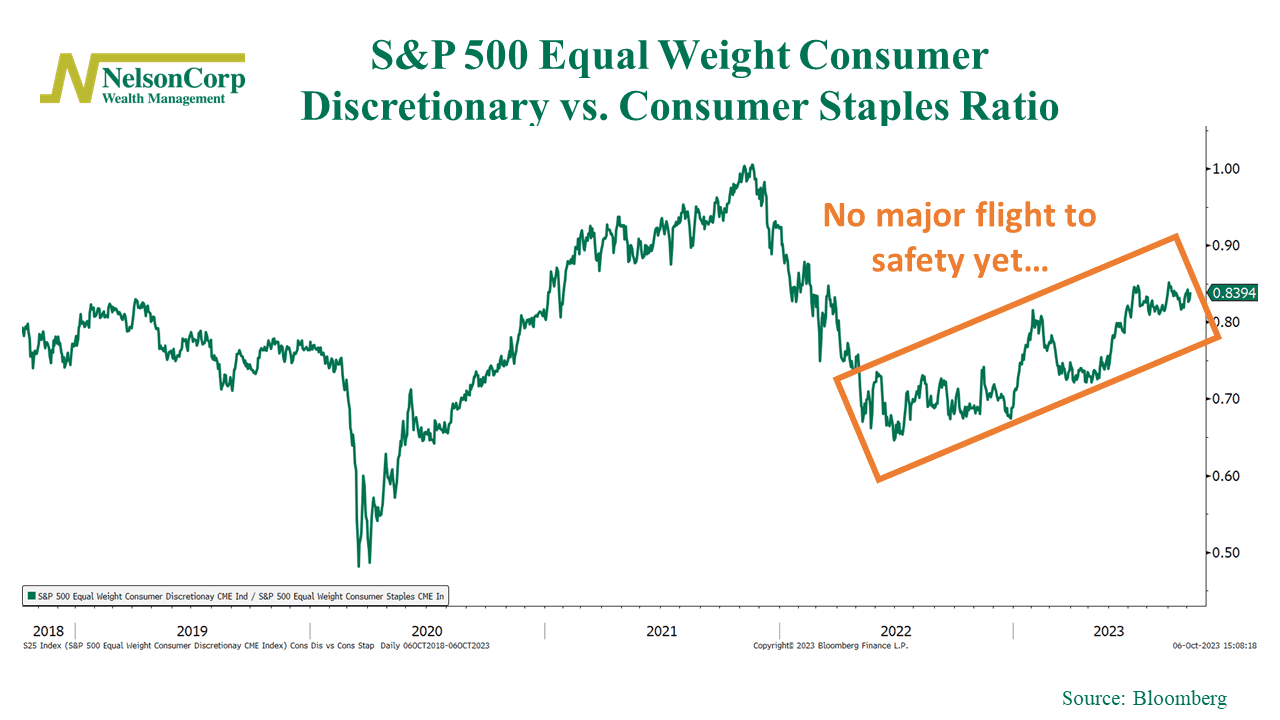
This is important because discretionary spending represents spending on things consumers want versus spending on staples—or things people need. If consumers are still splurging on things they want, it’s probably a sign that the economy is strong. And stocks tend to do well in a strong economy.
The bottom line, though, is that we’d like to see the stock market hold the line here at its key technical level (the 200-day moving average, or about 4200 on the index). This is important because if this key support level fails to hold, it could really start to complicate things, as it would throw into question the prevailing underlying trend of the stock market—which, up until a couple of months ago, was primarily to the upside.
This is intended for informational purposes only and should not be used as the primary basis for an investment decision. Consult an advisor for your personal situation.
Indices mentioned are unmanaged, do not incur fees, and cannot be invested into directly.
Past performance does not guarantee future results.
The S&P 500 Index, or Standard & Poor’s 500 Index, is a market-capitalization-weighted index of 500 leading publicly traded companies in the U.S.
The post Hold the Line first appeared on NelsonCorp.com.