OVERVIEW
It was another mixed week for U.S. stocks. The S&P 500 Index climbed 0.45%, and the Dow Jones Industrial Average gained nearly 0.8%, but the tech-heavy Nasdaq Composite fell 0.18%. Small-cap stocks were the week’s biggest loser, down around 1.5%.
Foreign markets were relatively subdued, with emerging markets registering moderate gains of less than 0.1% and developed country stocks declining about 0.2%.
Longer-duration bond prices picked up as Treasury yields fell across the board. The benchmark 10-year Treasury rate fell to 4.63%, a 17-basis point decline from last week’s close of 4.8%, and 30-year Treasury rates fell about 20 basis points to 4.77%. However, the 2-year Treasury rate’s decline was more muted, dropping just three basis points to 5.05%.
The decline in interest rates helped push real estate prices higher, to the tune of more than 1.5% for the week. Commodity prices also traded higher on the back of firmer crude oil prices, which rose about 6%, most of which came on Friday. Gold also surged more than 5% for the week. And finally, the U.S. dollar strengthened about 0.6% against the world’s major currencies.
KEY CONSIDERATIONS
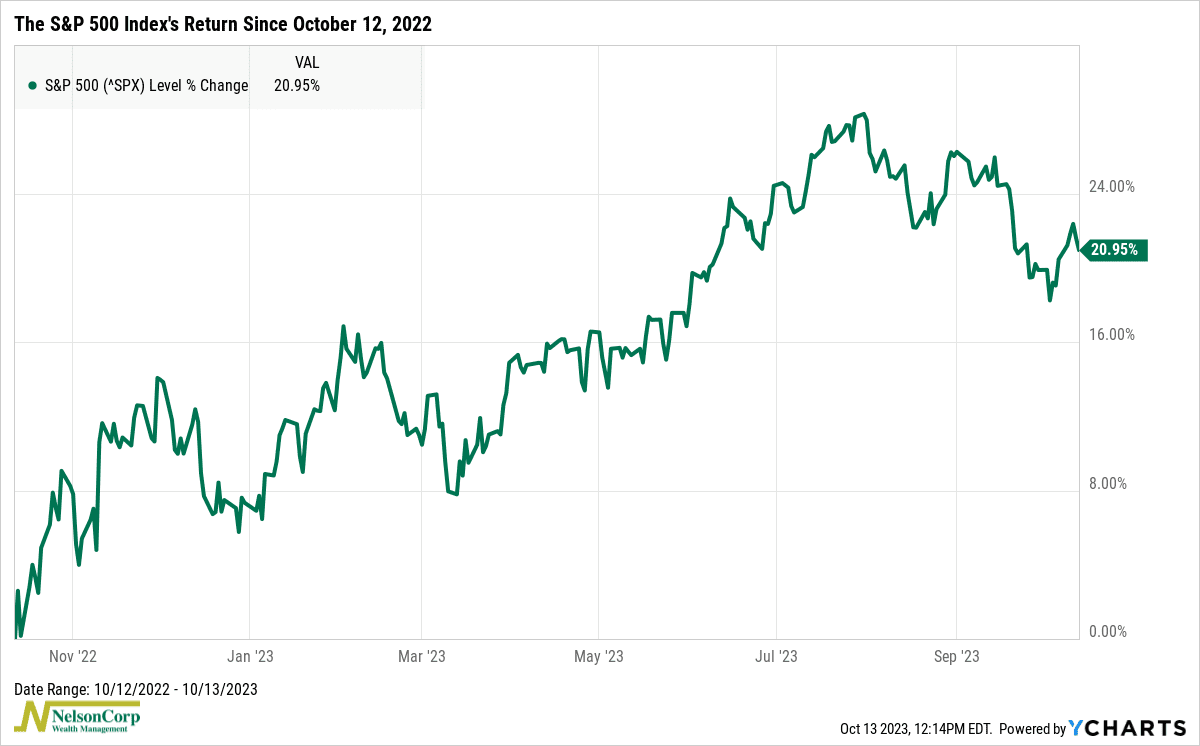
Happy Birthday – Happy birthday to the stock market! The bull market in U.S. stocks turned one-year old last week. The S&P 500 Index bottomed out on October 12, 2022 (a year ago), after suffering a brutal 25% drop, but has since rebounded with a roughly 20% gain.
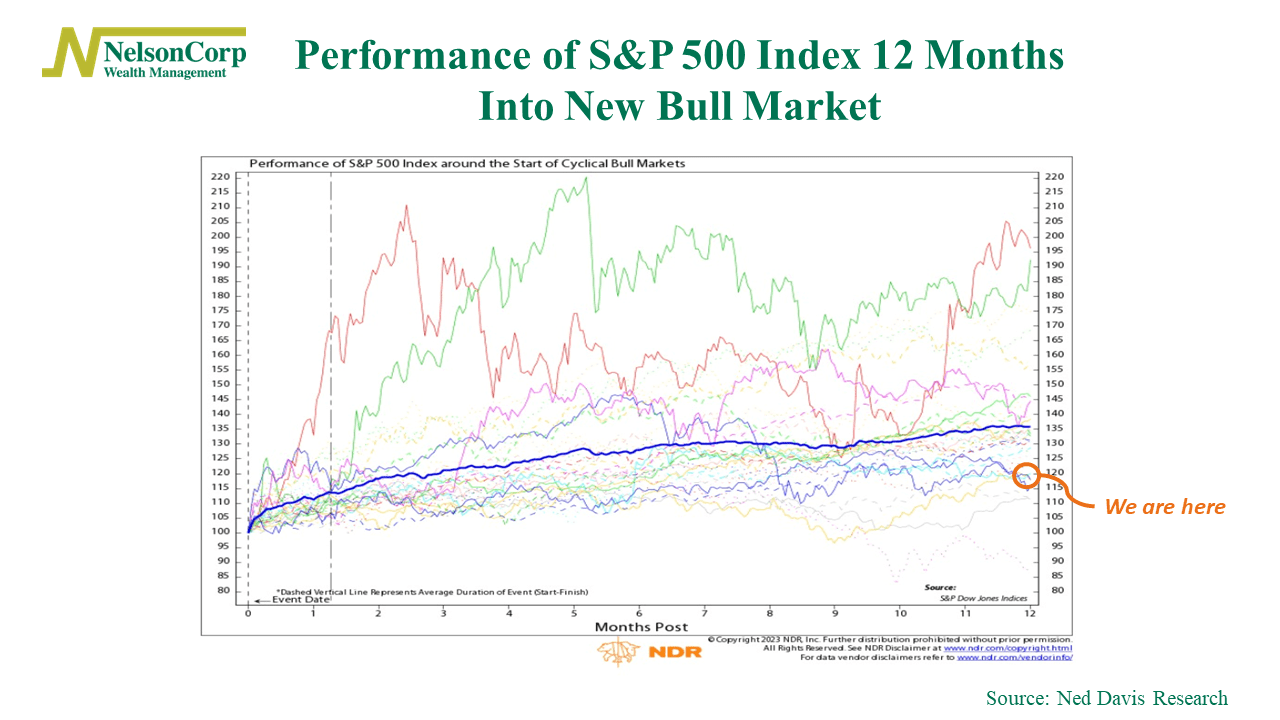
Not bad. But if we compare it to the other bull markets in history, we find that this has been one of the weaker starts to a bull market on record. In fact, the current bull market is in the bottom 15% of all bull markets. As the dark-blue line on the chart below shows, the average bull market has gained more than 35% in its first year.
That said, however, the bull market is hanging in there despite being weaker than average. For one, the S&P 500 Index avoided dropping below a key technical level last week—its 200-day moving average. In fact, it bounced pretty strongly. And the 200-day moving average itself continues to trend higher.
This was enough to cause one of our key momentum indicators to go neutral after being negative. The indicator, shown below, measures the 1-year (252 trading days) rate-of-change of the S&P 500 Index (smoothed by ten days) and uses standard deviation bands to determine when the index’s momentum is reversing. When the rate-of-change measure falls below the upper standard deviation band, it triggers a sell signal. This happened back in August.
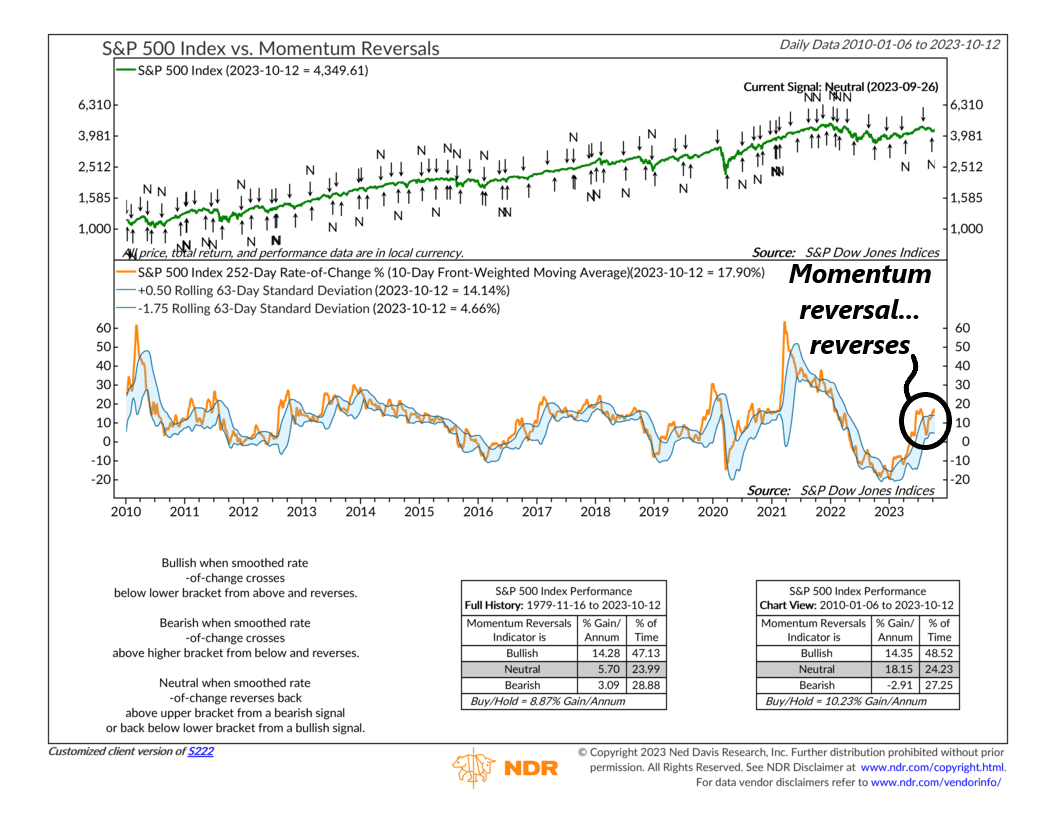
But since then, this momentum reversal indicator well… reversed. It climbed back above the upper standard deviation band, effectively neutralizing the previous sell signal. We take this as a sign that the recent sell-off was at least partially overdone.
Another area where we’ve seen a reversal in momentum? Sentiment. As this next chart shows, a composite indicator of investor sentiment designed to measure short- to intermediate-term swings in investor psychology recently fell to extreme pessimism levels.
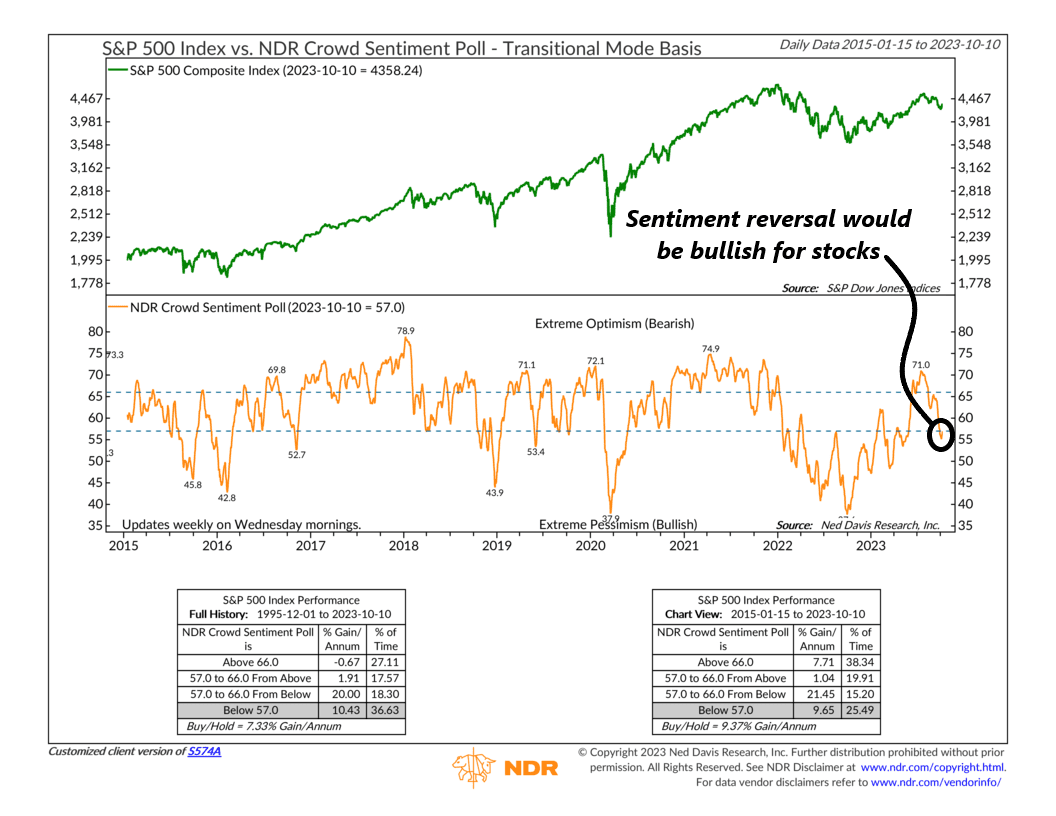
The key thing to watch here is a subsequent rise back into the middle zone of the chart. This would represent a reversal in sentiment from an extreme zone of pessimism. Historically, this is where the S&P 500 Index has performed the best, registering average gains of about 20% per annum, according to the chart.
Despite all this, however, one indicator still has us suspicious of the latest rally. It’s called the Advance/Decline (A/D) line, shown in the middle portion of the chart below.
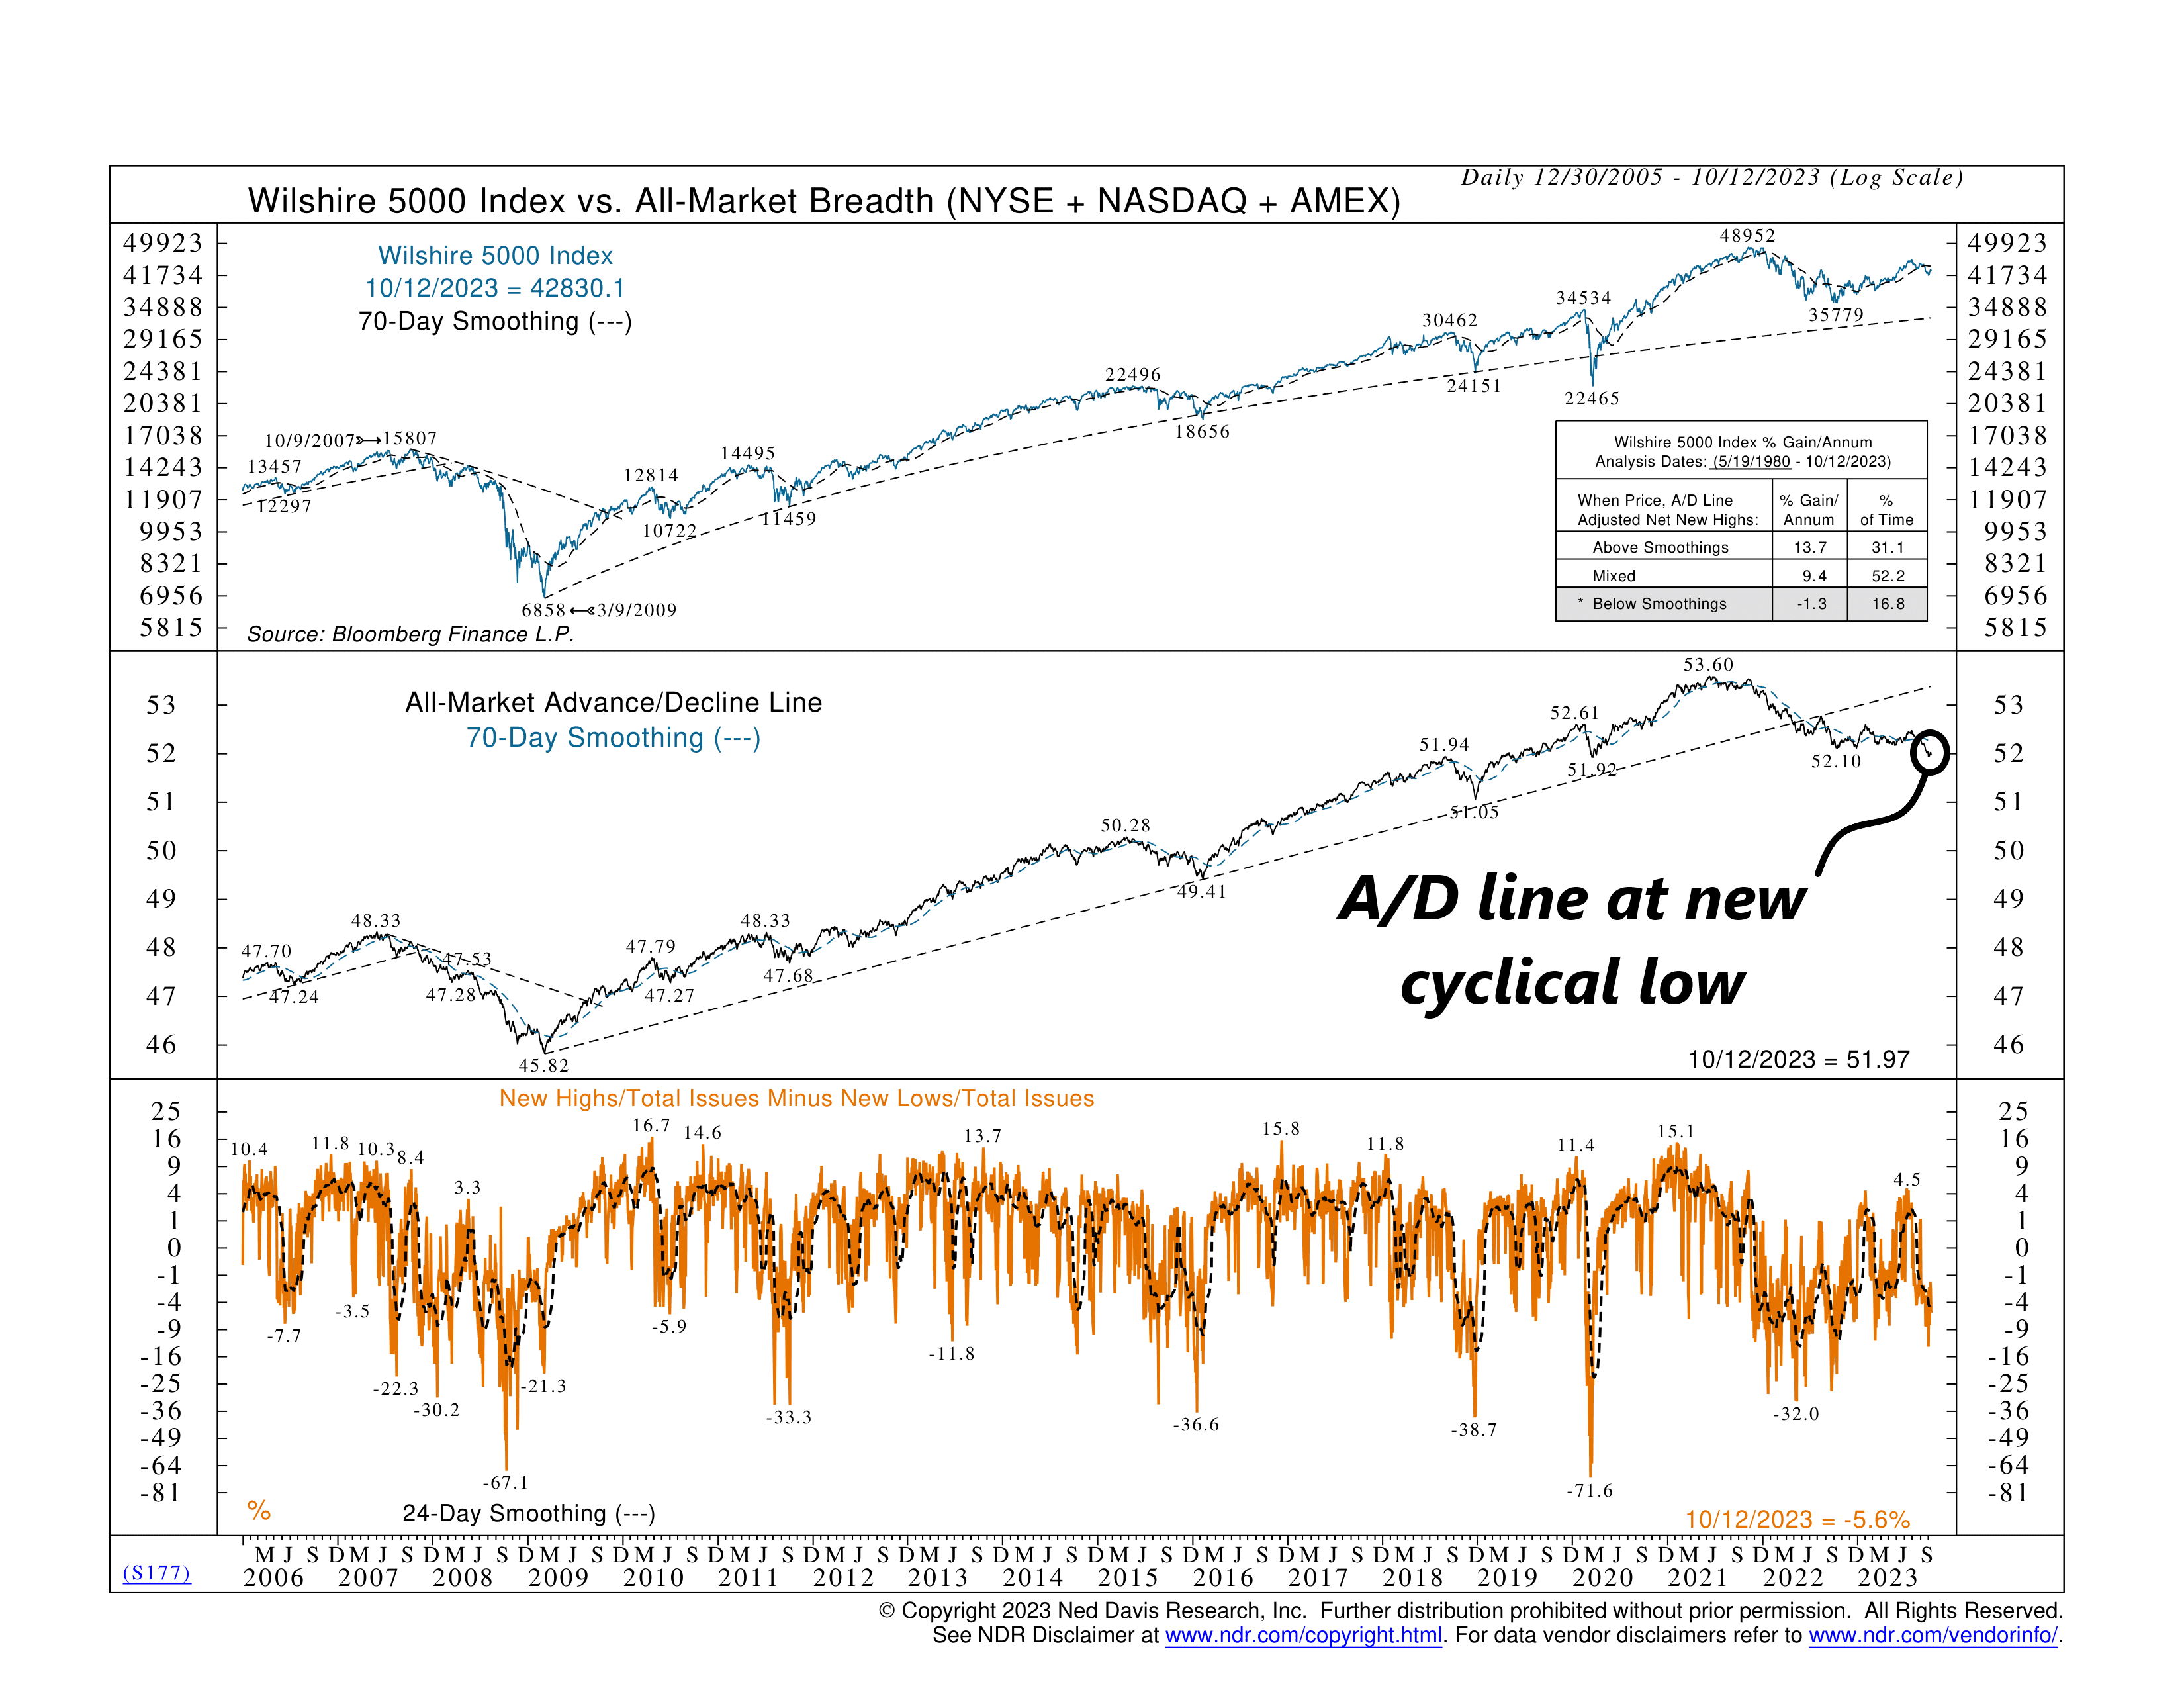
The A/D line is a breadth indicator used to measure how many stocks are participating in a market rally or decline. It plots the daily difference between the number of advancing and declining stocks in a cumulative fashion. If the stock market is rising but the A/D line is falling, we call that a divergence and it’s a sign that the market’s rally is not as healthy as it seems.
Indeed, the chart shows that the A/D line is currently trading at a cyclical low despite the stock market (top clip) trending higher. This is very much “out of character” for the stock market, and we’d chalk this up as a negative as far as market breadth is concerned.
So, the bottom line is that it’s been encouraging to see some technical price-based measures hold up recently in the stock market, even though we appear to be in a weaker bull market relative to history. If the recent reversal in extreme pessimism can be sustained, it could set the market up for a nice year-end rally. Longer-term, however, we still see some underlying issues related to market breadth that would prevent us from going “all-in” on risk assets at this current juncture.
This is intended for informational purposes only and should not be used as the primary basis for an investment decision. Consult an advisor for your personal situation.
Indices mentioned are unmanaged, do not incur fees, and cannot be invested into directly.
Past performance does not guarantee future results.
The S&P 500 Index, or Standard & Poor’s 500 Index, is a market-capitalization-weighted index of 500 leading publicly traded companies in the U.S.
The post Happy Birthday first appeared on NelsonCorp.com.