OVERVIEW
It was a slightly bumpy ride for U.S. stocks last week as volatility, as measured by the VIX Index, rose mid-week but ultimately ended the week roughly where it started.
Large-cap stocks had a rough time, as the S&P 500 Index fell 0.74% and the Dow Jones Industrial Average dipped 1.34%. Small-cap stocks fared better, though, as the Russell 2000 Index saw an increase of about 0.5% for the week. The tech-heavy Nasdaq Composite also managed to eke out a gain of about 0.06%
As for foreign stocks, it was a down week. Developed country stocks fell around 1.4%, and emerging markets dropped about 1.35%. The U.S. dollar also strengthened to the tune of about 0.6% against the world’s major currencies.
Over in the bond market, we saw the U.S. 10-year Treasury yield increase to 4.58%, up from the previous week’s close of 4.44%. Short-term rates, however, fell to 5.05%, down from 5.097% the week before. The result was a narrowing of the yield curve’s inversion, which is now just -0.47%, a pretty significant reversal from the mid-summer low of -1.08%.
In the commodity space, crude oil prices increased slightly to about $90.77 per barrel. Gold prices, however, plummeted over 4% to close out the week. The end result was about a 1.3% decline in the broad-based Bloomberg Commodity Index.
KEY CONSIDERATIONS
Hanging by a Thread – The theme of this week’s market commentary is “hanging by a thread” because that’s what the market has been doing lately.
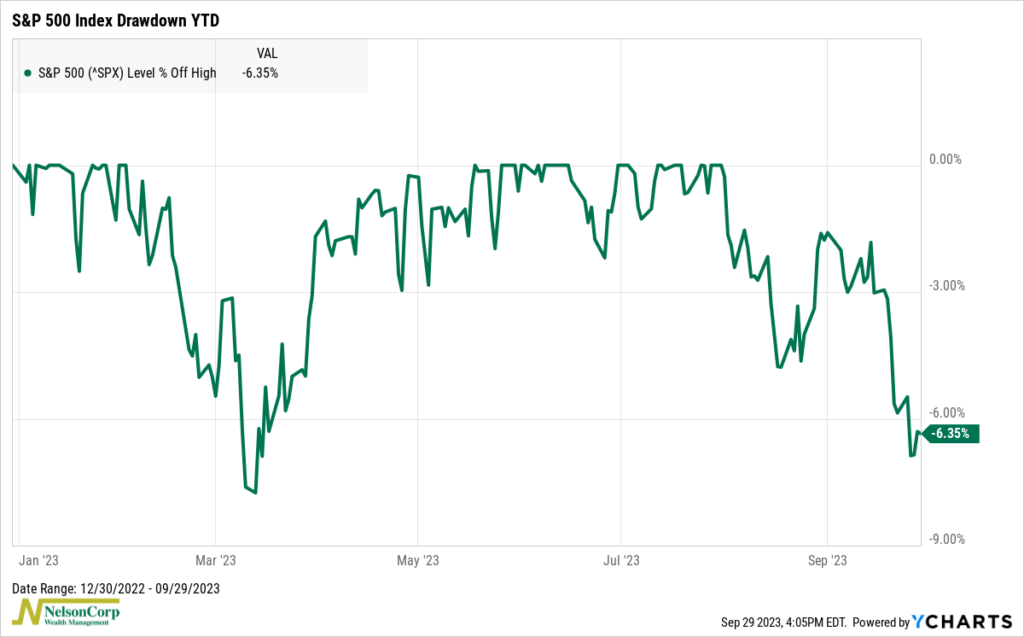
For example, in this week’s Indicator Insights blog post, we highlighted a “trend reversal” indicator that we use to identify when the stock market is, well, reversing its trend. The indicator uses weekly closing levels only, and as we pointed out in the post, the key level to watch out for is about 4252 on the S&P 500 Index, or 7.2% below its July 28th high for the year.
Luckily, as the drawdown chart below shows, we didn’t quite reach that level by Friday’s close. It got close at one point during the week—dropping to about 6.87% off its high—but a late-week rally kept things afloat.
Moving on, I have another chart that shows just how precarious (and narrow) this year’s stock market gains have been. It shows the traditional market-capitalization weighted S&P 500 Index (green line) versus the equal-weighted version of the S&P 500 Index (gold line). As you can see, the S&P 500 is up around 12% year-to-date, whereas the equal-weighted version is essentially flat (no gains) for the year.
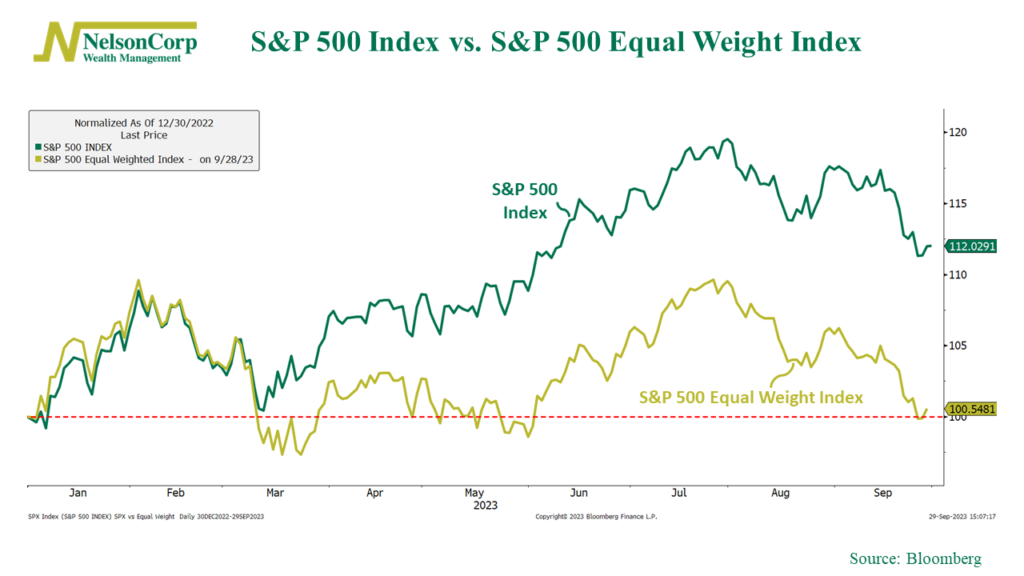
That’s pretty astonishing. It’s basically saying that if you had bought equal amounts of every stock in the S&P 500 at the beginning of the year, you’d have zero gains right now while the actual S&P 500 Index entered a new bull market.
How can this be? Well, here’s that same chart, but with the Bloomberg Magnificent 7 Index (orange line) added. This index represents the 7 largest stocks in the S&P 500. Amazingly, it’s up a whopping 84% this year!
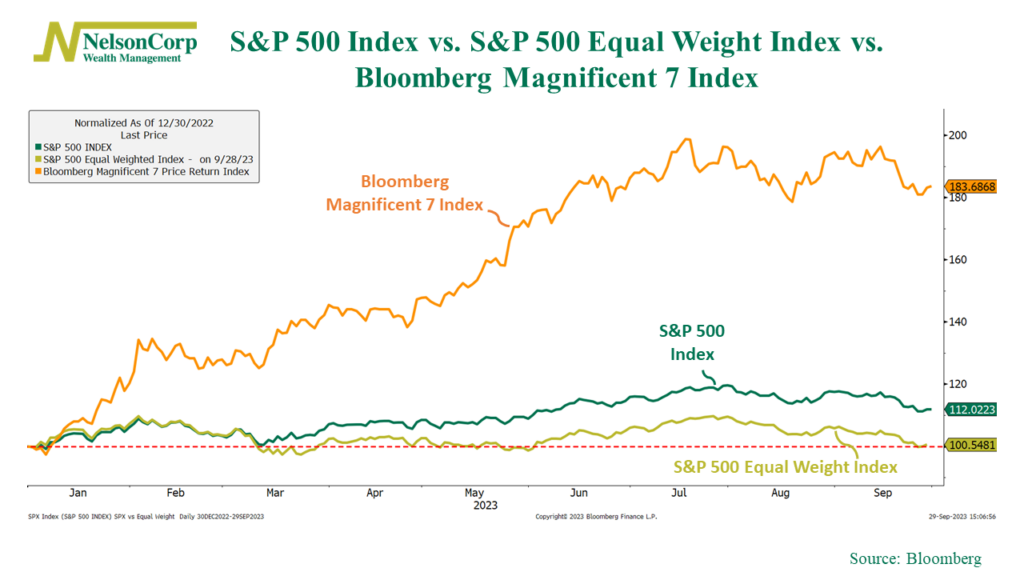
So basically, the takeaway from all this is that most of this year’s stock market gains can be attributed to just a few stocks. This is concerning. What happens if they roll over?
Now, everything I’ve discussed so far is based solely on the price action (or price movements) of the stock market. The good news is that we’ve seen just enough improvement in some external factors lately that it’s managing to keep our primary stock market risk model from going entirely negative.
For example, one area that has been strong is Investor Positioning, or what investors are actually doing with their money (as opposed to how they say they feel about the market). The following indicator measures the ratio of total assets in leveraged long U.S. stock ETFs to all inverse U.S. stock ETFs (smoothed by 7 days and normalized using a 63-day z-score).
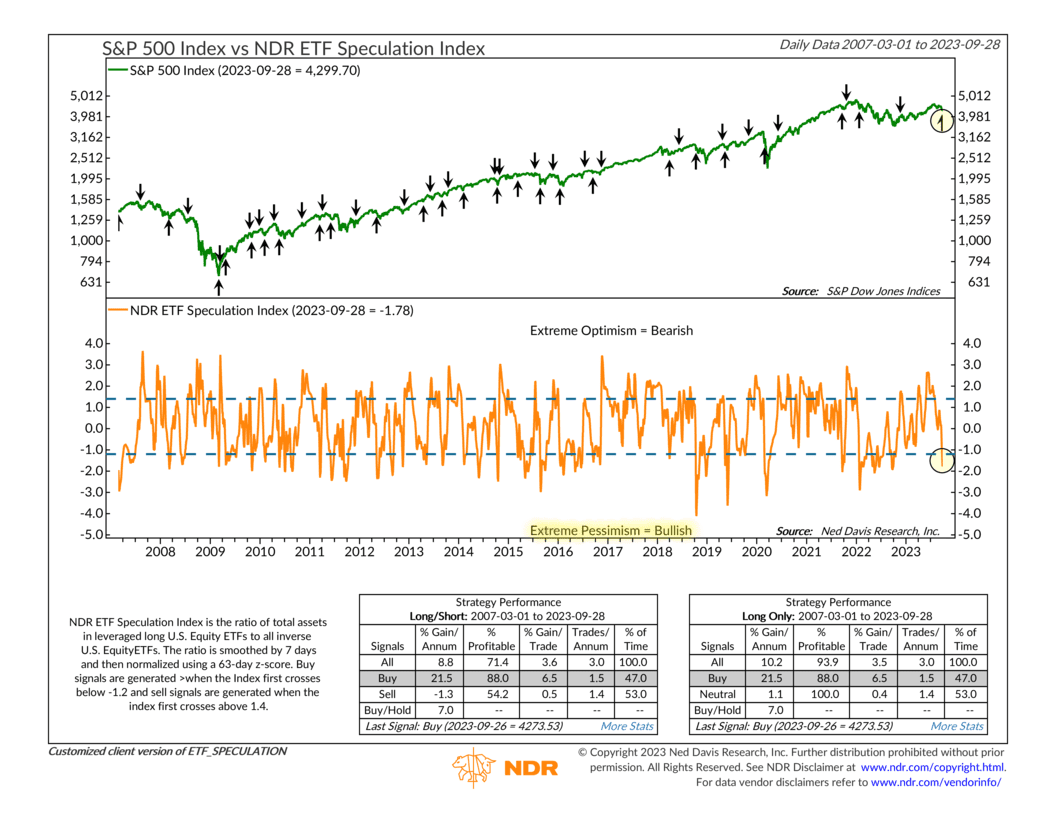
When the indicator (orange line) falls below the lower bracket line—like it did last week—it triggers a buy signal. Essentially, this is a sign of extreme pessimism because investors are pouring money into ETFs that bet against the stock market. And since the crowd tends to be wrong at extremes, we take this as a bullish condition for stocks going forward—and the historical performance of the indicator backs up this conclusion.
So that’s at least some good news. I’ll end with one more piece of semi-good news, which I think encapsulates the idea that the economy and stock market are “hanging on by a thread.”
It’s a chart that shows the ISM Composite, or the average reading of the ISM Purchasing Manager’s Index (PMI) and the ISM Non-Manufacturing Index (NMI). Essentially, it’s a measure of the health of the U.S. economy. Since this is a diffusion index, readings above 50% indicate growth, and readings below 50% indicate contraction. The latest monthly reading for the ISM Composite is 51.05%. This is an improvement from some of the earlier readings this year, in which the composite was below 50% (indicating a contraction in the manufacturing and services sectors of the economy).
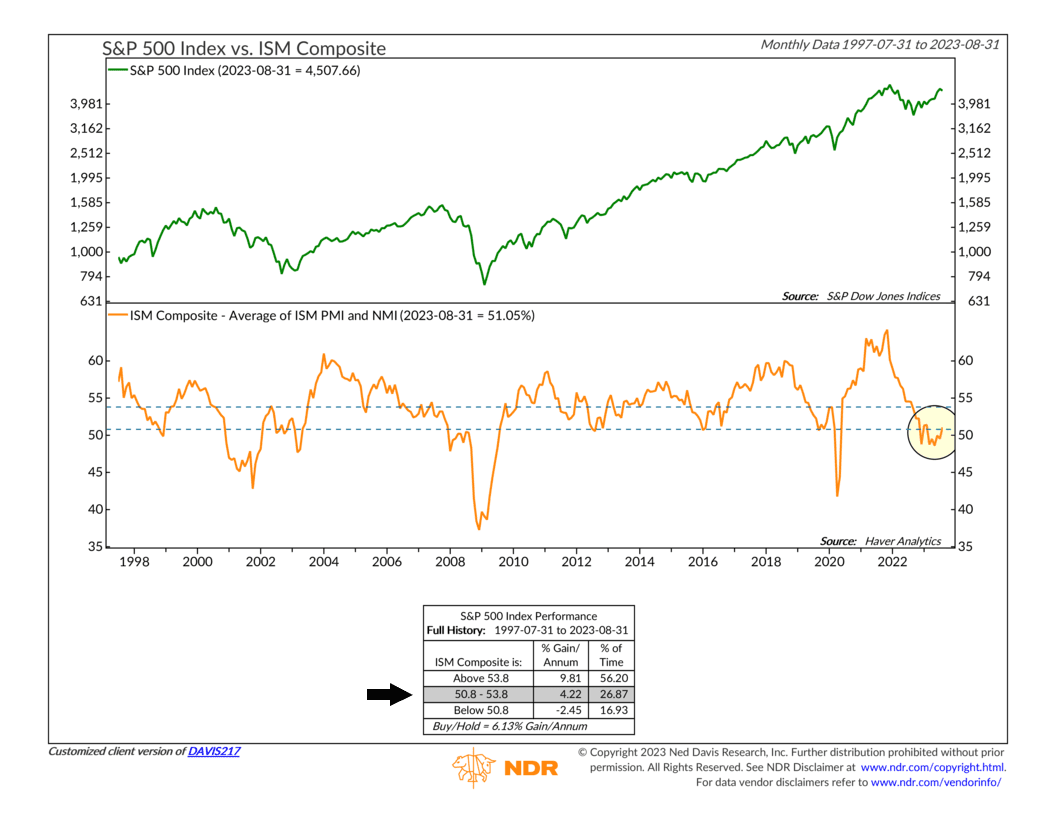
As I’ve highlighted on the chart, the current reading is marginally in the neutral zone, where stock returns have historically averaged slightly below-average gains. In other words, the economy is hanging in there—but just barely. We’ll get the September reading for the ISM Composite in the next week or two, and we’ll have our eyes on that for sure.
The bottom line? The stock market’s recent performance has been bad—but not terrible. The S&P 500 Index is hanging in there—by a thread—with a precarious reliance on a select few high-performing stocks. While some positive signals from investor positioning and economic indicators provide a glimmer of hope, the overall situation remains fragile, underscoring the need for vigilance in the coming weeks and months ahead.
This is intended for informational purposes only and should not be used as the primary basis for an investment decision. Consult an advisor for your personal situation.
Indices mentioned are unmanaged, do not incur fees, and cannot be invested into directly.
Past performance does not guarantee future results.
The S&P 500 Index, or Standard & Poor’s 500 Index, is a market-capitalization-weighted index of 500 leading publicly traded companies in the U.S.
The post Hanging by a Thread first appeared on NelsonCorp.com.