OVERVIEW
U.S. stocks rallied last week, with the S&P 500 climbing 2.47%. The Dow Jones Industrial Average rose 1.81%, and the Nasdaq Composite surged 4.32%.
Growth stocks were out in front of the rally, swelling 3.34% for the week, whereas value stocks rose about 1.8%. As for size, large-cap stocks rose 2.83% versus a 2.05% gain for small-cap stocks.
Foreign stocks underperformed the U.S. but were still positive for the week. Developed country stocks rose about 1.4%, and emerging markets gained 1.44%.
The bond market was mostly positive despite a rise in the 10-year Treasury rate to 3.5% from 3.48% the week prior. While intermediate-term Treasuries edged lower by 0.02%, long-term Treasuries gained about 0.56%. Investment-grade corporate bonds rose 0.24%, and high-yield (junk) bonds increased 0.38%. Municipal bonds were flat, and TIPS rose 0.45%.
Commodities were down broadly by roughly 0.5%, dragged lower by the 2.87% decline in oil. However, gold increased slightly by about 0.04%, and corn increased 1%. Real estate saw a big surge, climbing over 3% for the week. And the U.S. dollar inched higher by 0.11%.
KEY CONSIDERATIONS
Gathering Steam – We saw continued progress in the stock market’s technical health last week. The indicator evidence has improved noticeably—particularly on the price action side of things.
For example, a key long-term technical indicator recently confirmed that the recent rally is likely legitimate. Shown below, this indicator measures the percentage of U.S. stocks that are trading above their average 200-day price.
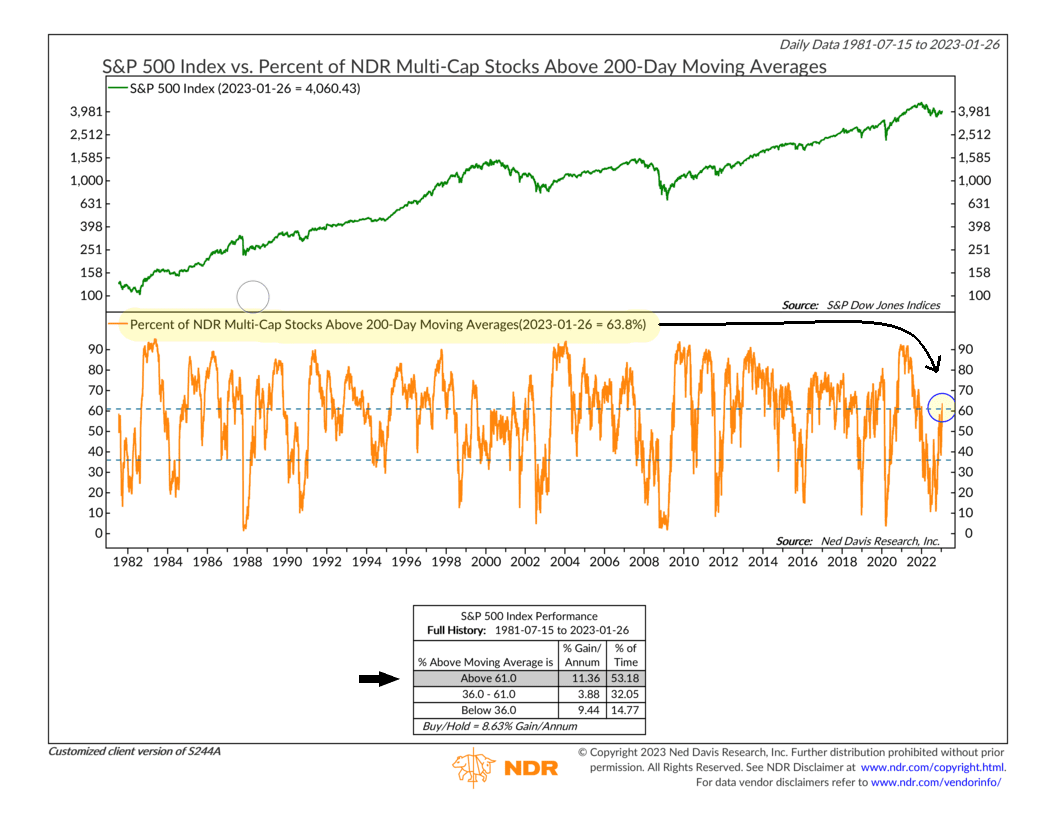
It climbed to roughly 64% last week, enough to trigger a bullish signal.
In other words, if you pick a random stock in the stock market, there is roughly a 2/3rds chance that it is trading at a price level that is higher than its average price over the past 10 months or so.
This is what we call “bullish breadth,” and it’s a sign that the market is getting healthier from a technical perspective.
In fact, this indicator has historically triggered a “buy” signal about 3.5 months after a bear market low. Indeed, the latest signal came about 3.5 months after the S&P 500’s low on October 12th, 2022.
So, more and more signs are pointing to less cloudy skies ahead for the stock market.
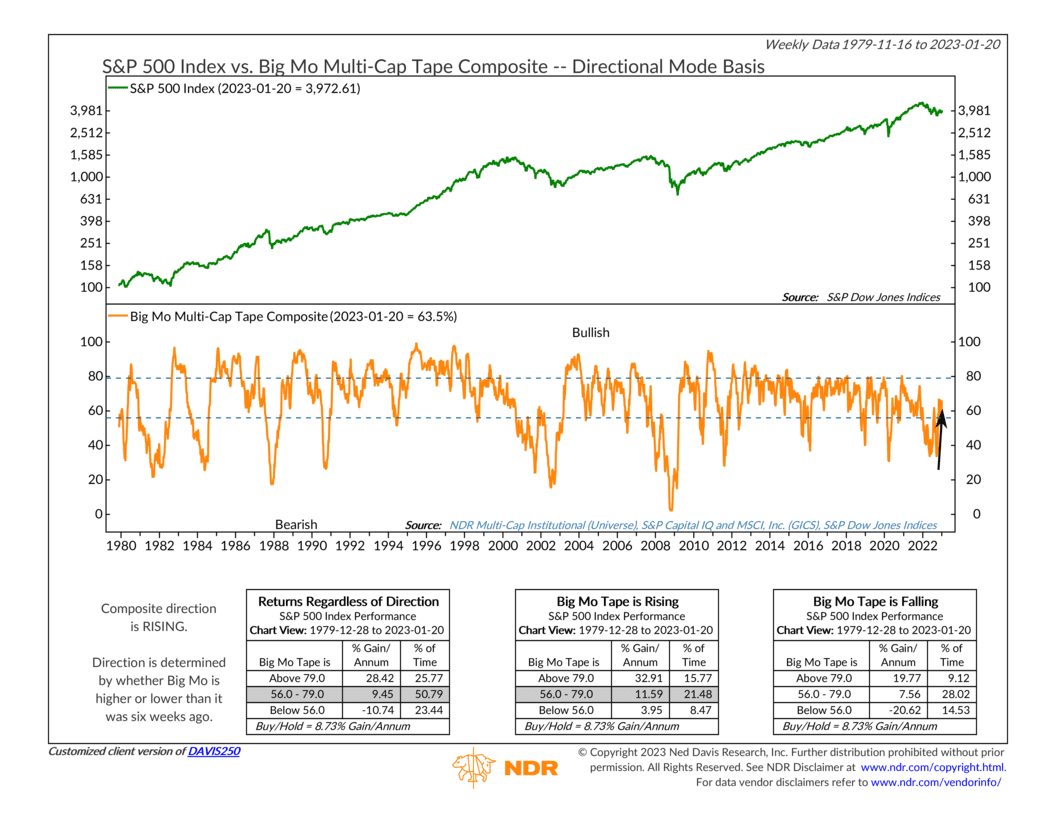
For more examples, we also highlighted a couple of other indicators on our blog this week that indicate that the risk/reward tradeoff is starting to favor more equity exposure.
One of the indicators, shown below, says that momentum has built up enough steam in S&P 500 subindustries that market returns could be pretty strong in this sort of environment.
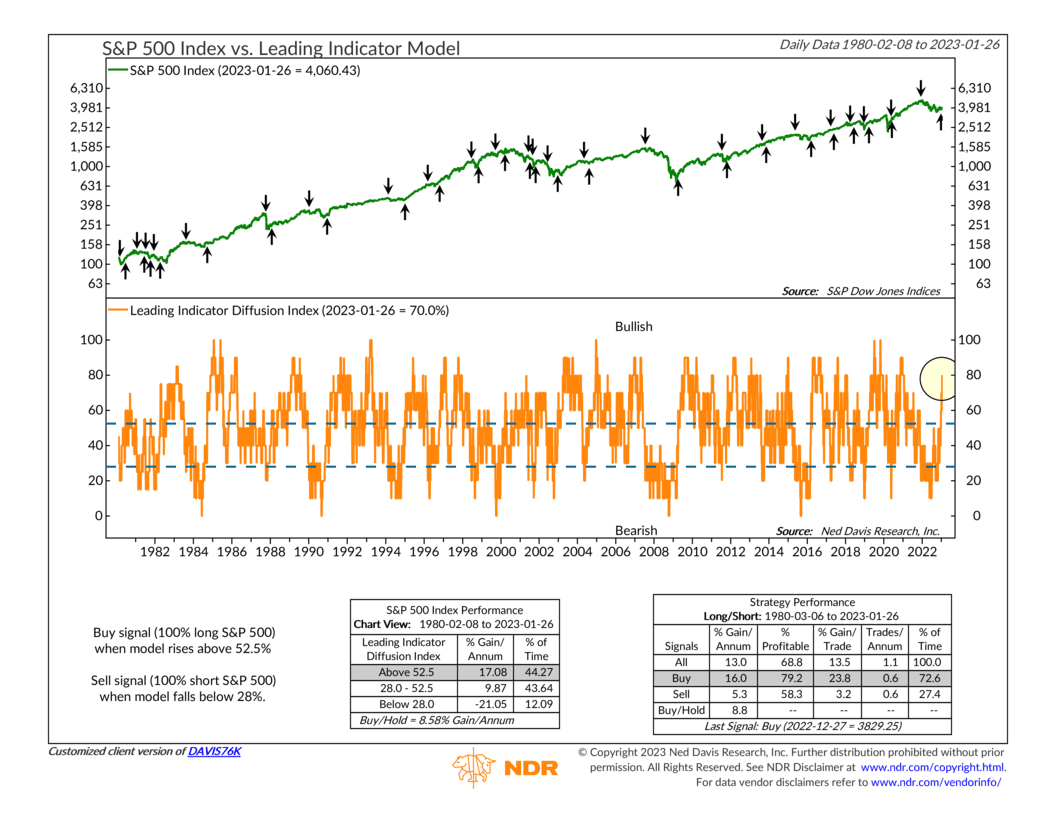
And the other indicator, featured in our chart of the week post, shows that 70% of the indicators that tend to lead the market are in bullish uptrends. This suggests that the current rally is better positioned to be sustainable than the failed attempts last March, May, August, and November.
The bottom line? Enough strength has accumulated in various technical, price-based indicators that the weight of the evidence is shifting to a more “neutral” zone for stocks at this time.
This is intended for informational purposes only and should not be used as the primary basis for an investment decision. Consult an advisor for your personal situation.
Indices mentioned are unmanaged, do not incur fees, and cannot be invested into directly.
Past performance does not guarantee future results.
The post Gathering Steam first appeared on NelsonCorp.com.