OVERVIEW
The U.S. stock market ended another tough week that saw the S&P 500 drop 1.58%, the Dow fall 1.9%, and the NASDAQ declined 1.76%. The weekly declines left the S&P 500 flirting near 10% correction territory once again.
While holding up better than domestic stocks so far this year, foreign stocks still had a rough week. Developed country stocks fell 1.9%, and emerging markets dropped 0.7%.
Bonds held up better, however, with intermediate-term Treasuries gaining 0.13% for the week and long-term Treasuries remaining flat. Municipal bonds rose 0.04%, and TIPS gained 0.07%. However, investment-grade corporate bonds fell 0.87%, and high-yield junk bonds dropped 0.25%.
Real assets were mixed. While real estate saw a weekly decline of 1.22%, commodities rose 1.58%. Gold had a big week, rising 3.13%, but oil fell around 1.52%. The U.S. dollar remained unchanged for the week.
KEY CONSIDERATIONS
Flimsy Market – The stock market continued to struggle last week. The 1.6% decline in the S&P 500 left the index down more than 9% off its highs.
Looking at the various indicators that we track on a weekly basis, we still don’t see a whole lot that suggests the U.S. stock market is any stronger than “neutral” at best right now.
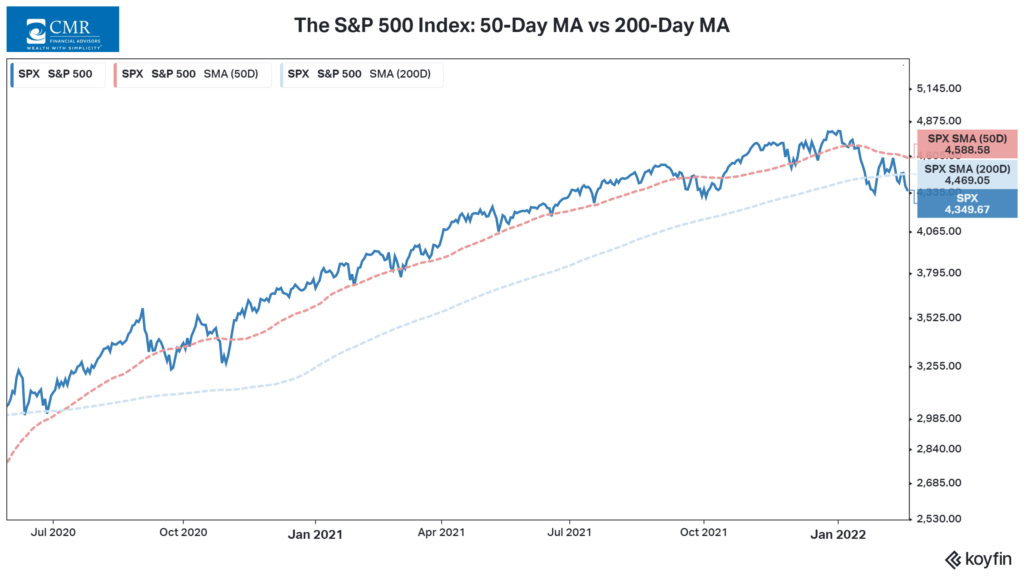
If we focus on just the S&P 500 index, which tracks the 500 largest companies in the U.S. by market capitalization, the trend—or overall direction—of stock prices looks…OK.
As the chart below shows, the shorter 50-day average price of the index is still trading above its longer 200-day average price, which is generally a good sign. However, the two averages are getting closer to each other with each passing week, and the longer-term 200-day average price is flattening out, a sign of slowing momentum.
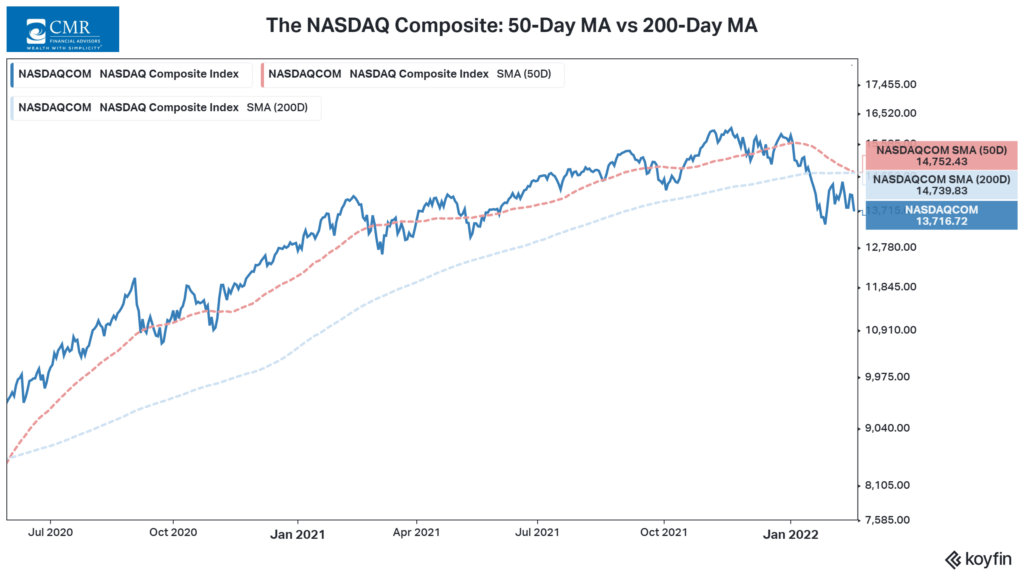
The NASDAQ Composite, which is more tech-focused than the S&P 500, doesn’t look much better; in fact, it looks worse. The average 50-day price is now trading neck-in-neck with its average 200-day price and will likely fall below it soon—producing the dreaded “death cross,” as it’s commonly known.
From a technical perspective, then, this is not necessarily a great outlook for the internal health of the stock market. Overall, our indicators imply that the market’s price action is neither great nor terrible. So, for that reason, we’ll say it’s primarily neutral at the moment.
As for the external factors that affect the stock market, we’ve been looking to see if things would improve in sentiment-based areas, like investor behavior. To be sure, we have seen that area somewhat improve. But even here, things look mostly neutral at best.
Take margin debt, for example. When it’s going up, it tends to be a sign that investors are confident about the stock market. However, it started rolling over a few months ago, and last month, it dropped sharply—to the tune of about 9% in just one month. Historically, drops this severe have been a troubling sign for the overall stock market.
So, given the weakened state of the stock market both internally and externally, a cautious approach to risk-taking is still the best plan of action.
This is intended for informational purposes only and should not be used as the primary basis for an investment decision. Consult an advisor for your personal situation.
Indices mentioned are unmanaged, do not incur fees, and cannot be invested into directly.
Past performance does not guarantee future results.
The post Flimsy Market first appeared on NelsonCorp.com.