OVERVIEW
The major U.S. stock indexes gave up most of the ground they had gained the previous week, falling around 1% to 2%. Specifically, the S&P 500 dropped 1.3%, the Dow fell 0.75%, and the Nasdaq dived 1.93%.
Small-cap stocks really took it on the chin, with the benchmark index falling roughly 3.6% for the week, extending a recent run of underperformance. Foreign stock markets were also down in the 1.2% to 1.4% range for the week.
Concerns over further potential rate increases in the coming months sent the prices of most bonds down. The 2-year Treasury yield, a rough proxy for where the market thinks the Fed is headed with short-term rates, closed just below 5%, shy of its year-to-date peak of 5.05%.
Oil prices continued to climb, rising about 1.8% last week. Commodities overall, however, fell about 0.6%. Gold dropped 1.24%, and corn increased around 0.5%. Real estate fell over 1%, and the U.S. dollar strengthened by 0.9%.
KEY CONSIDERATIONS
Fishhooks and Sentiment – It was a down week for U.S. stocks. Although it appeared as if the S&P 500 index was finally starting to gather some upside momentum, it just couldn’t be sustained last week.
As our 85-day stochastic indicator shows below, a “fishhook” formed just below the chart’s upper bracket last week. This indicator measures stock market momentum, and a rise above that line would have neutralized the negative momentum signal from last month, indicating that the selling pressure had become exhausted. But alas, the market didn’t have enough juice, and the indicator rolled back over.
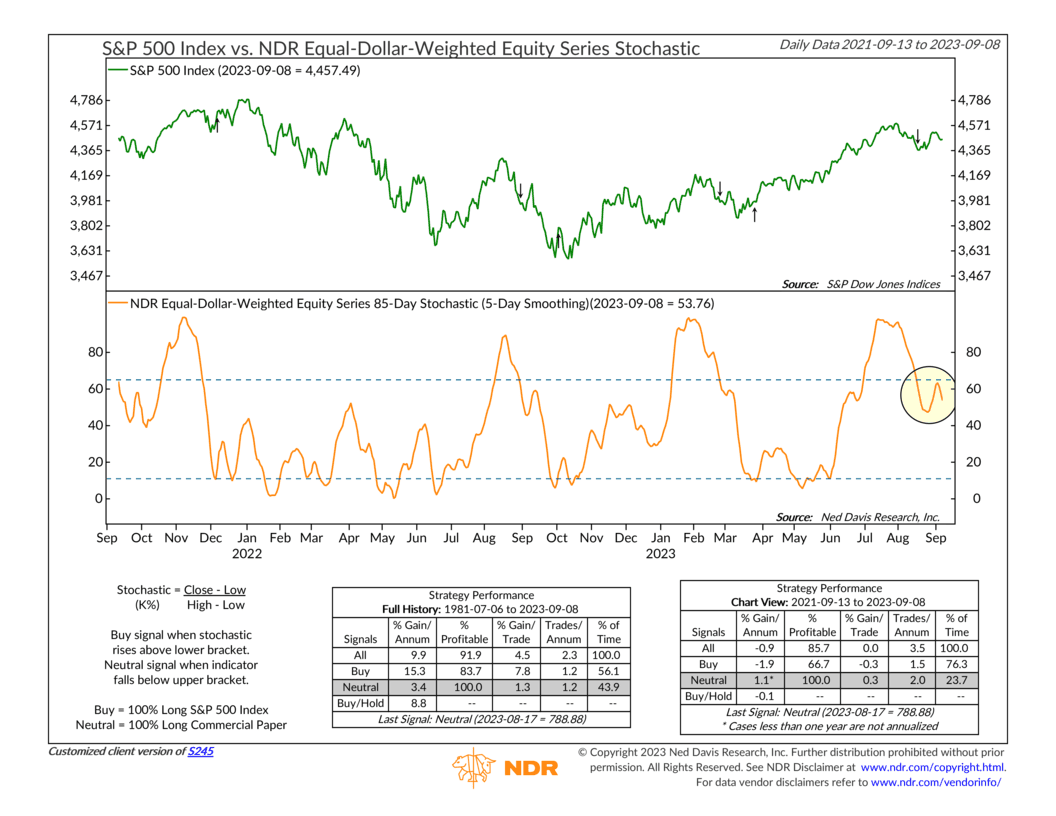
What’s holding the market back?
Well, one culprit we could point a finger at is the U.S. dollar. It’s been on a tear ever since it bottomed in July. Coincidentally, that also happens to be when the S&P 500 topped out for the year.
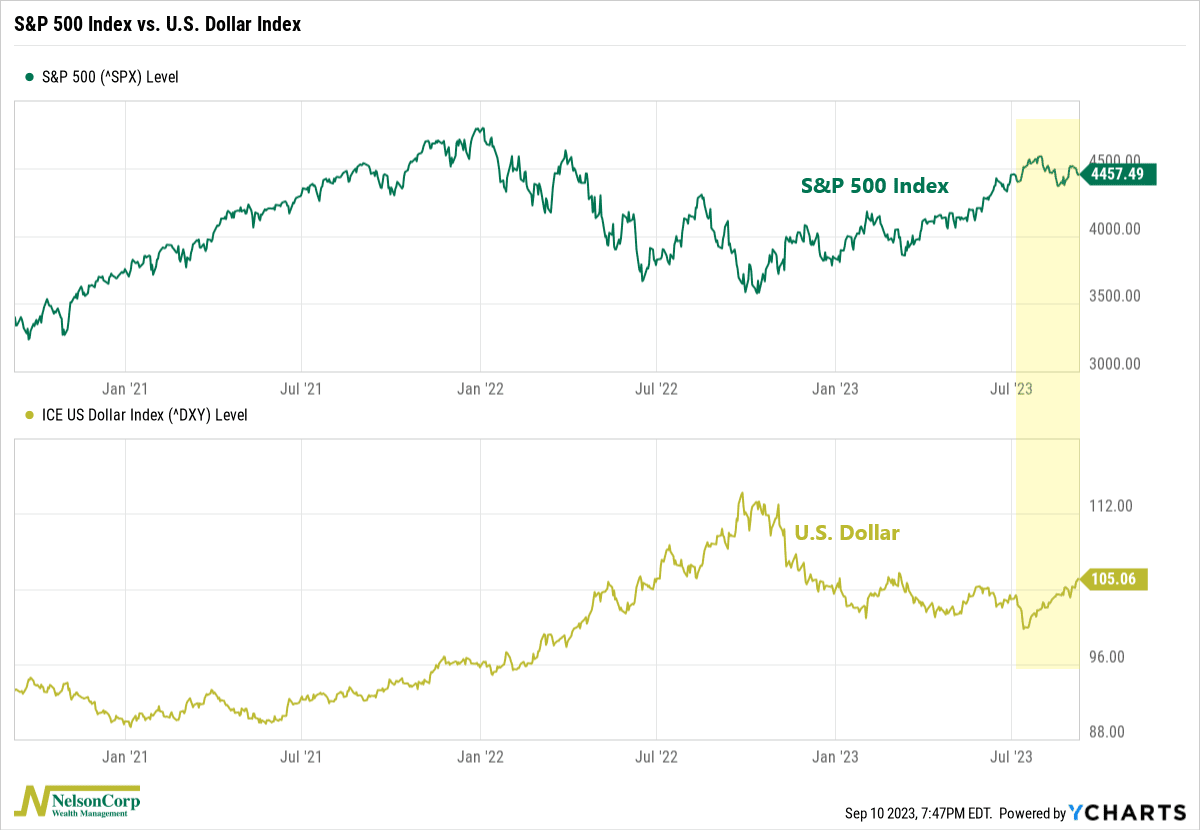
A stronger dollar isn’t always bad for stocks. But recently, this seems to be the case, and that’s not all that surprising given the fact that so many of the stocks in the S&P 500 index are multinational. This means a large chunk of their profits get potentially devalued when the dollar strengthens.
The dollar aside, though, another factor to consider is sentiment. As this next chart shows, measures of long-term sentiment peaked in July. Although the indicator fell into neutral territory recently, it remains near the top of that range.
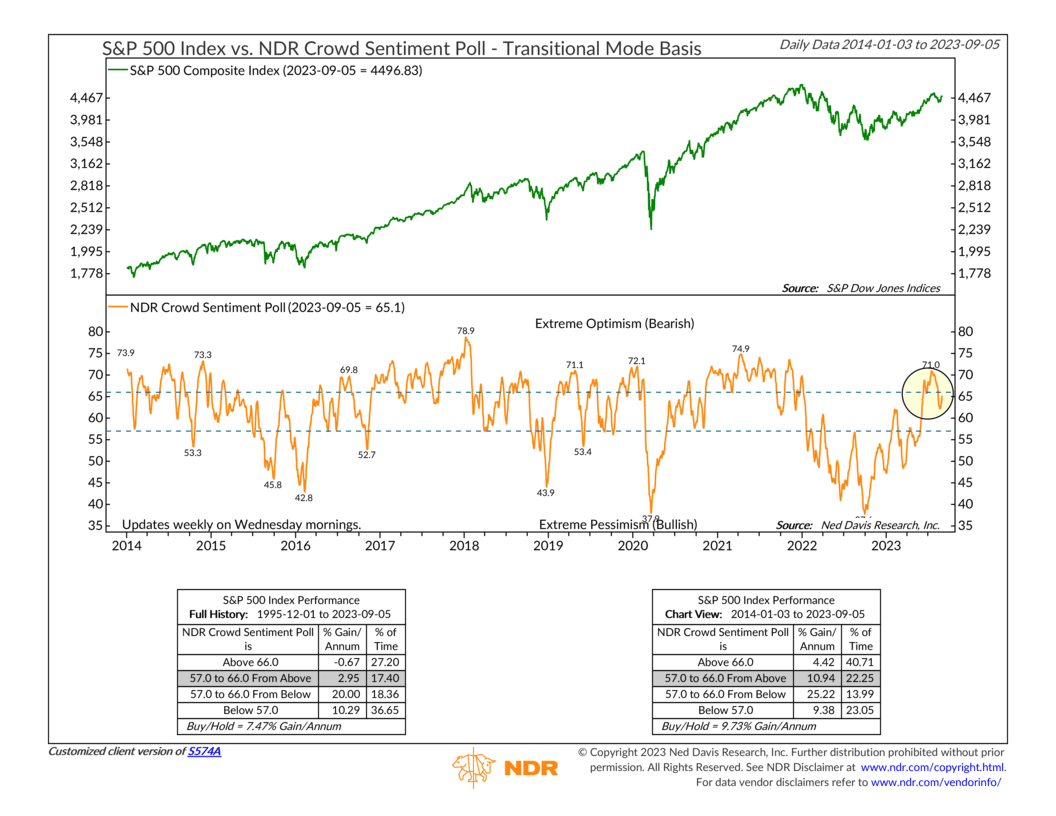
A reversal higher into extremely optimistic (bearish) territory wouldn’t be all that great for the prospects of a year-end rally. However, if the market remains defensive in the short term, more pessimism could drop this indicator into the lower (bullish) zone, which could potentially help stimulate a year-end rally.
So, the big picture is that the market is still chopping along in a sideways fashion after peaking this summer. The market’s price action, while weakened, is still holding ground, but external factors—like the U.S. dollar and sentiment—continue to complicate matters.
This is intended for informational purposes only and should not be used as the primary basis for an investment decision. Consult an advisor for your personal situation.
Indices mentioned are unmanaged, do not incur fees, and cannot be invested into directly.
Past performance does not guarantee future results.
The post Fishhooks and Sentiment first appeared on NelsonCorp.com.