OVERVIEW
U.S. stocks moved moderately higher last week, with the S&P 500 gaining about 0.5%, the Dow increasing 0.8%, and the Nasdaq up about 0.3%. The Russell 2000 index of small-cap stocks also rose about 0.5%.
For the most part, foreign stocks outperformed U.S. stocks. Developed countries gained a little over 1%, and emerging markets surged about 1.7%.
Bonds saw moderate price gains as yields dipped slightly lower. The benchmark 10-year yield fell to about 3.88%, resulting in a 0.1% gain for intermediate-term Treasuries. In aggregate, bonds rose about 0.3% for the week.
Real estate had a good week, climbing about 1.1%. Commodities, on the other hand, dipped about 0.8%, led lower by a 3.5% drop in oil prices. The U.S. dollar also weakened about 0.3% for the week.
KEY CONSIDERATIONS
Embracing Risk – There’s a famous quote attributed to the American author John A. Shedd that says, “A ship is safe in harbor, but that is not what ships are built for.”
Financial markets have taken this quote to heart recently.
The chart below is what we call a Risk-On/Risk-Off Diffusion Index. It looks at a combination of financial market indices that are positively correlated with strong market returns and subtracts a combination of indices that are negatively correlated with strong market returns. When this line is rising—and particularly when it gets above 50—it’s a sign that investors are getting cozy with financial market risk-taking.
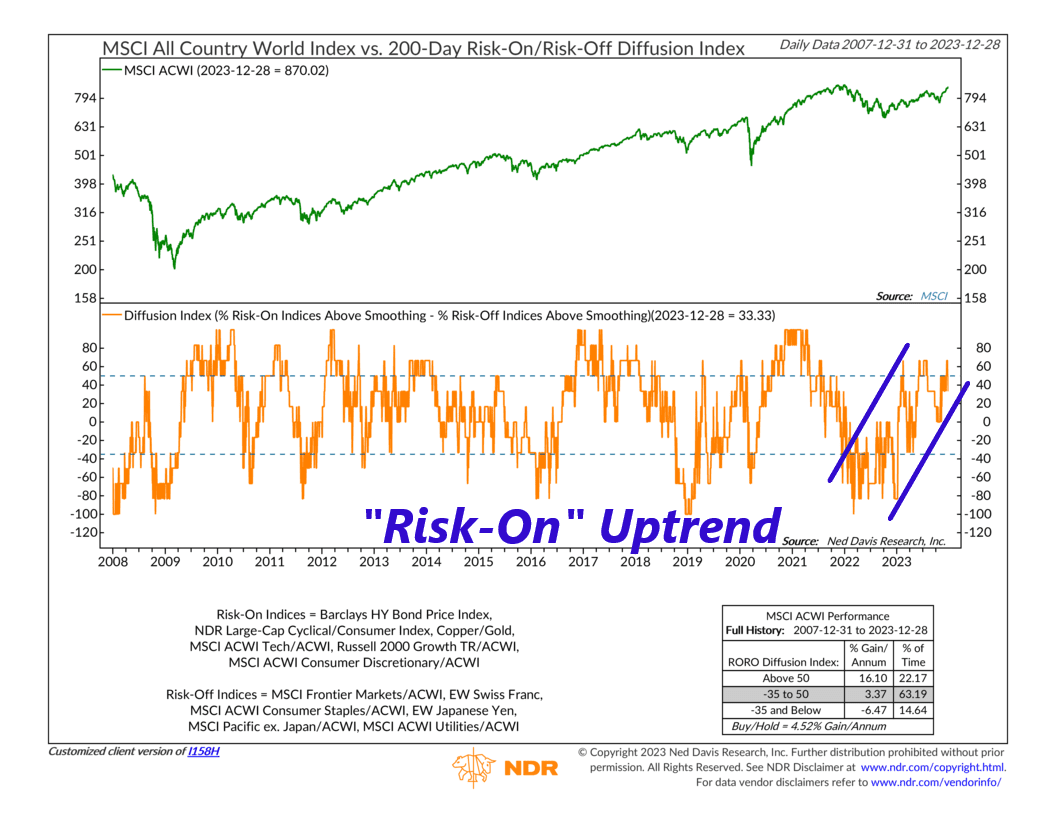
As you can see, it’s been on an uptrend for many months now. If this indicator can get about 50 and stay there, the historical record suggests there’s a good chance that stocks will be able to generate above-average returns.
Another positive sign? Our Big Mo Tape indicator, which measures the percentage of stock market sub-industries in uptrends, climbed to 80% last week. This is its most bullish zone on the chart and one of its highest readings in a decade.
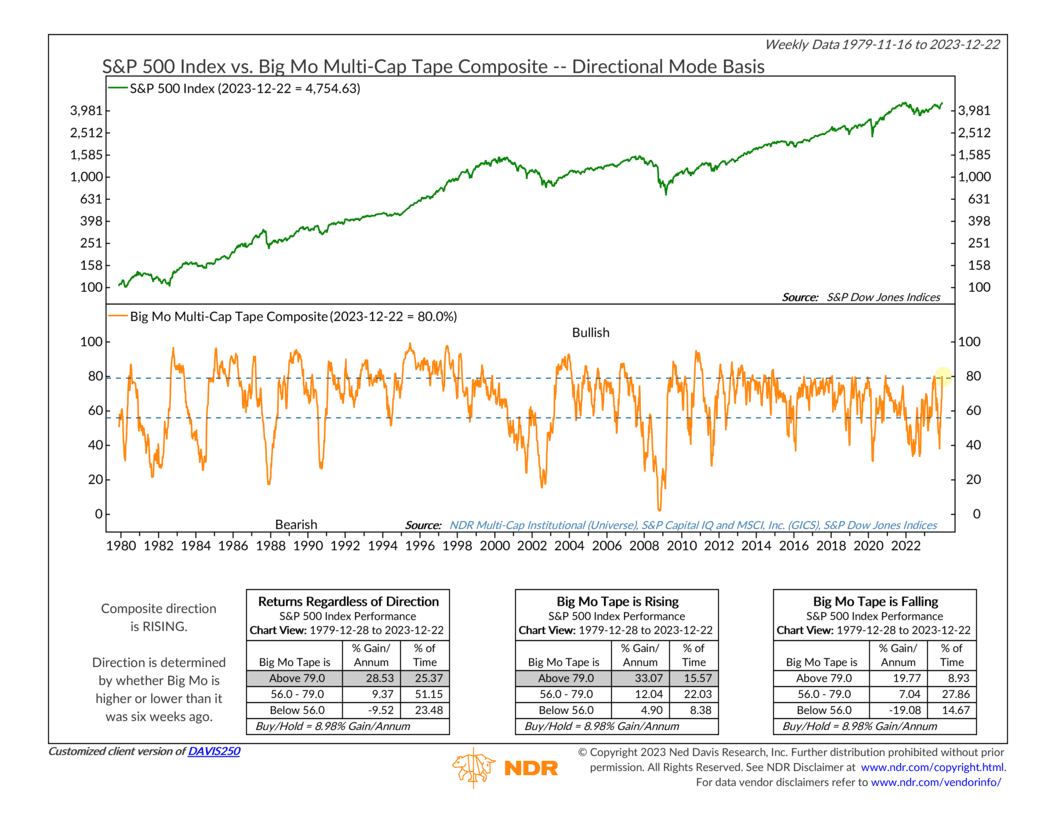
It hasn’t been able to stay in this zone for very long in recent years. But, the historical record suggests that returns for the S&P 500 are still typically quite good when this indicator hovers near these heights.
So, we are seeing a lot of bullish indicator evidence right now. But, of course, a big catalyst for the recent stock market rally has been the better-than-expected economic environment. The Citi Economic Surprise Index, shown below, measures this by looking at how much data from the past three months is beating or missing analysts’ expectations. It’s been on an uptrend since mid-2022.
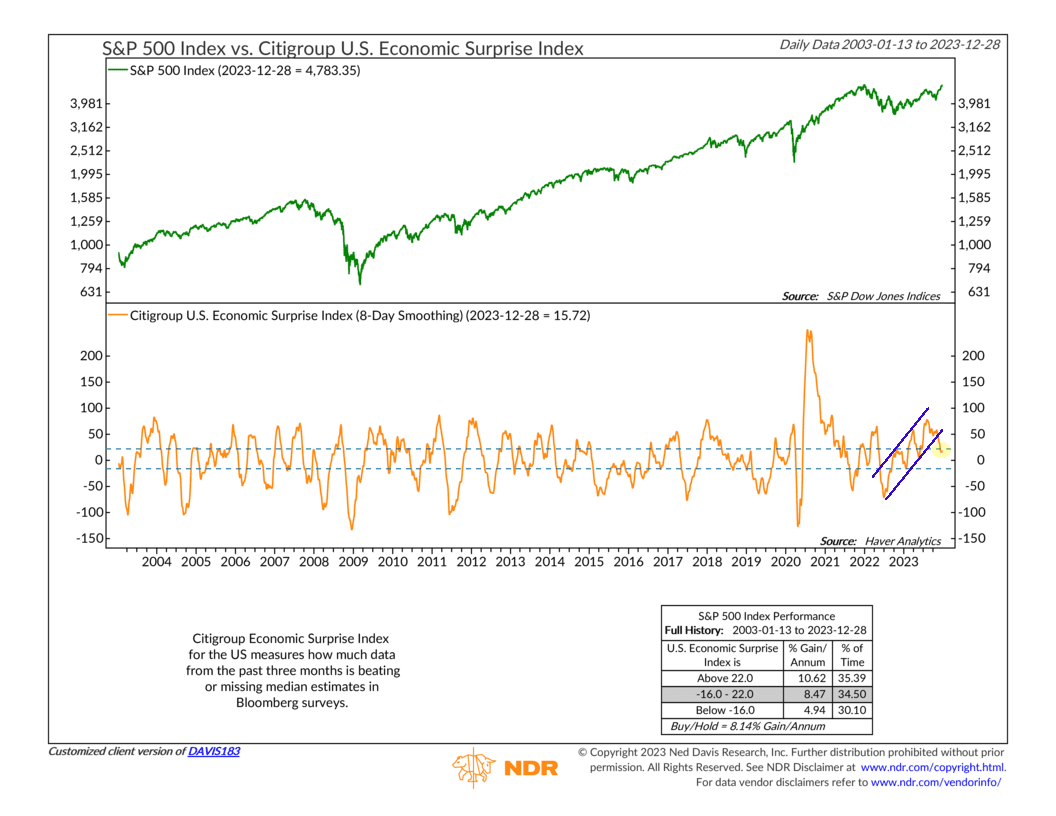
However, if you look closely, you’ll see that it peaked in August and has generally decreased since then. Technically, it’s still above zero. But it’s also in its neutral zone (between the dashed-line brackets) on the chart. While stock returns can still be quite good at these levels, it could quickly turn into a headwind if the economic data starts coming in lower-than-expected next year.
So, the main takeaway is that the market appears to be in one of those moods where it’s fully ready to embrace risk and push valuations higher. This isn’t necessarily a bad thing; in fact, by definition, it’s generally a bullish time to be invested. However, we will continue to monitor the weight of the indicator evidence and look out for those warning signs—like further deterioration in the economic surprise index—that could derail the rally.
This is intended for informational purposes only and should not be used as the primary basis for an investment decision. Consult an advisor for your personal situation.
Indices mentioned are unmanaged, do not incur fees, and cannot be invested into directly.
Past performance does not guarantee future results.
The S&P 500 Index, or Standard & Poor’s 500 Index, is a market-capitalization-weighted index of 500 leading publicly traded companies in the U.S.
The post Embracing Risk first appeared on NelsonCorp.com.