OVERVIEW
The U.S. stock market had a strong outing last week. The S&P 500 surged 2.35%, the Dow gained 2.02%, and the Nasdaq increased 2.19%.
Value stocks led the way, gaining 2.93%, but growth stocks weren’t too far behind, up 2.26% for the week. Small-cap stocks had a great week, rising nearly 4.3%.
Foreign stocks, on the other hand, were more mixed. While developed country stocks rose 1.62%, emerging markets fell 0.25%.
The bond market was also somewhat mixed in performance last week. While short-term Treasuries rose a moderate 0.08%, intermediate- and long-term Treasuries fell about 0.4%. Investment-grade corporate bonds rose 0.15%, and high-yield bonds increased 0.83%. However, municipal bonds fell 0.2%, and TIPS lost 0.25%.
Real estate had a strong week, up 4.3%. However, commodities fell about 0.85% broadly. This was driven by a 0.11% gain in the U.S. dollar.
KEY CONSIDERATIONS
Economic Bulls on Parade- The U.S. stock market has had a surprisingly strong first half of the year. In fact, as the chart below shows, the Nasdaq 100 Index just ended its best first half ever.

A lot of this is likely due to the better-than-expected economic data that has come out this year.
For starters, the latest GDP estimates showed that the economy grew at a 2% clip in the first quarter, up from the prior estimate of 1.3%.

According to the Bureau of Economic Analysis, this was due to upward revisions in things like exports, consumer spending, state and local government spending, and residential fixed investment.
In other words, the data aren’t trending in a way that suggests the much-anticipated recession is near.
But this isn’t really vibing with how people feel about the economy. If you were to ask, people would likely say they feel poorer than they were, say, two years ago.
Some have called this phenomenon a “vibecession.” In a nutshell, this just means that people feel like something is off about the economy, even though the measures economists use are saying something different.
One explanation for all this is that we’ve just been through a relatively prolonged period of negative real wage growth, meaning wages—after adjusting for inflation—were falling.
In other words, Americans have been working more and more for less and less over the past few years.
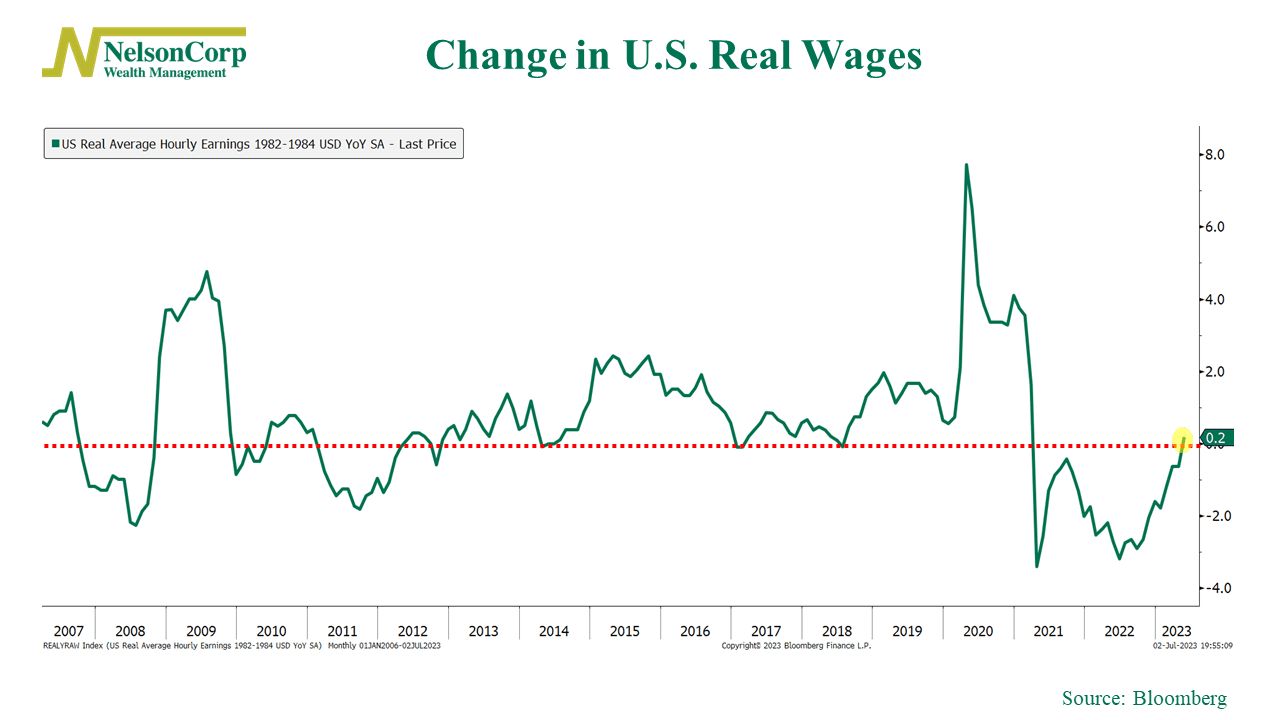
But, as the chart above shows, the good news is that real (inflation-adjusted) wages are actually positive and rising once again. This is good for consumers and, in turn, the economy.
Put this all together, and we’ve got a Bloomberg Economic Surprise Index (shown below) that is at its highest level in over two years.

The bottom line? The economy appears to be holding up reasonably well. In theory, this should be good for corporate profits, and that should be good for the stock market.
This is intended for informational purposes only and should not be used as the primary basis for an investment decision. Consult an advisor for your personal situation.
Indices mentioned are unmanaged, do not incur fees, and cannot be invested into directly.
Past performance does not guarantee future results.
The post Economic Bulls on Parade first appeared on NelsonCorp.com.
“Indices mentioned are unmanaged, do not incur fees, and cannot be invested into directly.” please add the following disclosure: The S&P 500 Index, or Standard & Poor’s 500 Index, is a market-capitalization-weighted index of 500 leading publicly traded companies in the U.S. The Dow Jones Industrial Average (DJIA) is a price-weighted index composed of 30 widely traded blue-chip U.S. common stocks. The Nasdaq 100 Index is a basket of the 100 largest, most actively traded U.S. companies listed on the Nasdaq stock exchange. The index includes companies from various industries except for the financial industry, like commercial and investment banks.