OVERVIEW
Another volatile week of trading on Wall Street saw the S&P 500 drop 0.63 percent, its fourth consecutive weekly drop. The Nasdaq, however, rose 1.11 percent.
While the energy, materials, and financial sectors had large weekly declines, the tech sector managed to stay in the black, gaining about two percent.
Losses were particularly large for international stock markets, amounting to more than four percent for both developed and emerging market countries.
Both high-yield and investment-grade corporate bonds sold off alongside equities, dropping 1.53 and 0.69 percent, respectively.
However, U.S. government bonds saw decent weekly gains as investors bid the 10-year yield down to 0.658 percent.
The U.S. dollar had a good week, gaining roughly 1.2 percent.
And commodities, which tend to worsen when the U.S. dollar strengthens, sold off by more than three percent.
KEY CONSIDERATIONS
Down, But Not Out – Another choppy week of trading and a fourth straight week of declines has left the S&P 500 stock index down about eight percent from its recent highs.
Our models have stayed fairly positive throughout this sell-off. Going into last week, our indicators leaned positive in the price movement and investor sentiment domains, and the economic environment was neutral.
However, the slowing momentum in stock prices over the past few weeks has weakened the price movement section of our models.
For example, the orange line in the chart below shows an 85-day stochastic indicator applied to the S&P 500 stock index. This indicator tells us if stocks are closing near the top or bottom of their recent price range, and can help us determine when stocks are reversing.
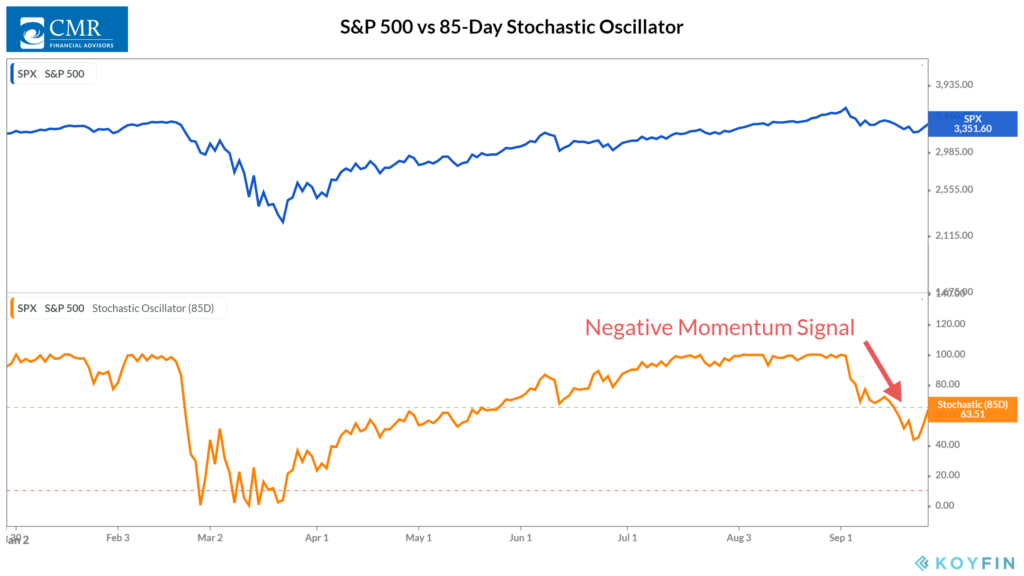
Last week, the stochastic line dropped below the upper bracket, triggering a negative signal. Unless it rises back above the upper bracket, momentum could continue to deteriorate from here.
And it’s not just momentum in the U.S. that is slowing. Global stock participation has declined, as well.
By one measure, the percentage of stock markets worldwide that are above their 50-day average price has collapsed to just 16.3 percent after being about 50 percent two weeks ago.
However, if we look at our external, non-price-based indicators, we do see some more encouraging developments.
Take margin debt, for example. When investors are confident, they borrow money from brokerage firms to participate in the upside move in stocks. We call this “going on margin.” And we’ve found that increasing margin debt corresponds with rising stock prices and vice versa.
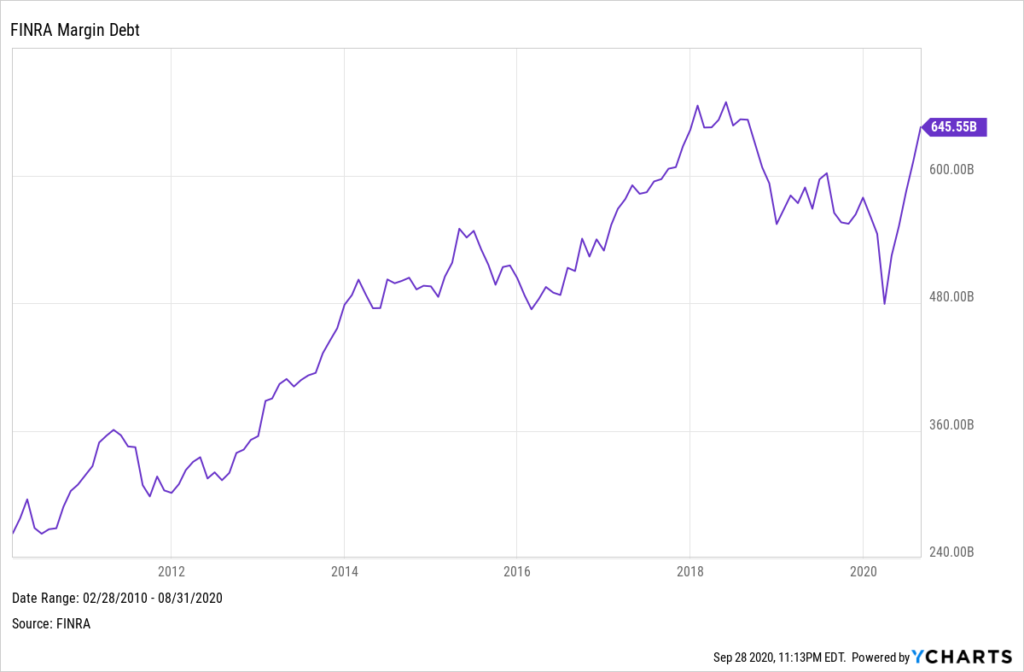
Last week, the Financial Industry Regulatory Authority (FINRA) revealed that margin debt rose in July and then again in August to roughly $645.55 billion. This is not far off from the high set in May 2018 of about $669 billion.
So the stock market is down, but not out. The weight of the evidence still leans to the positive side of things. But the slump in price returns could weigh more heavily as time goes on unless improvements are made from here.
This is intended for informational purposes only and should not be used as the primary basis for an investment decision. Consult an advisor for your personal situation.
Indices mentioned are unmanaged, do not incur fees, and cannot be invested into directly.
Past performance does not guarantee future results.
The post Down, But Not Out first appeared on NelsonCorp.com.