OVERVIEW
The U.S. stock market closed higher after a roller coaster type of week. The S&P 500 gained 1.39%, the Dow increased 1.18%, and the Nasdaq popped 1.66%.
Growth stocks—up 1.59%—outpaced value stocks, which rose about 1%. Small caps lagged the broader market, up about 0.56%.
In foreign markets, we saw a 1.53% gain for developed country stocks and a 2.17% increase for emerging markets.
The Treasury bond market rallied on the short-to-intermediate part of the curve as the 10-year rate fell to 3.37%, down from 3.43%. Investment-grade corporate bonds also increased around 0.86%, and high-yield (junk) bonds rose 0.35%.
Real estate was the biggest laggard last week, dropping about 2.18%. On the other hand, commodities were up about 0.42% broadly, led by a 3.92% gain for oil, a 0.58% increase for gold, and a 1.38% rise in corn prices. The U.S. dollar weakened by 0.6% to end the week.
KEY CONSIDERATIONS
Down but Not Out – The banking crisis continued to rumble through financial markets last week.
The economic threat, as highlighted in the chart below, is that banks have already begun tightening their credit standards.
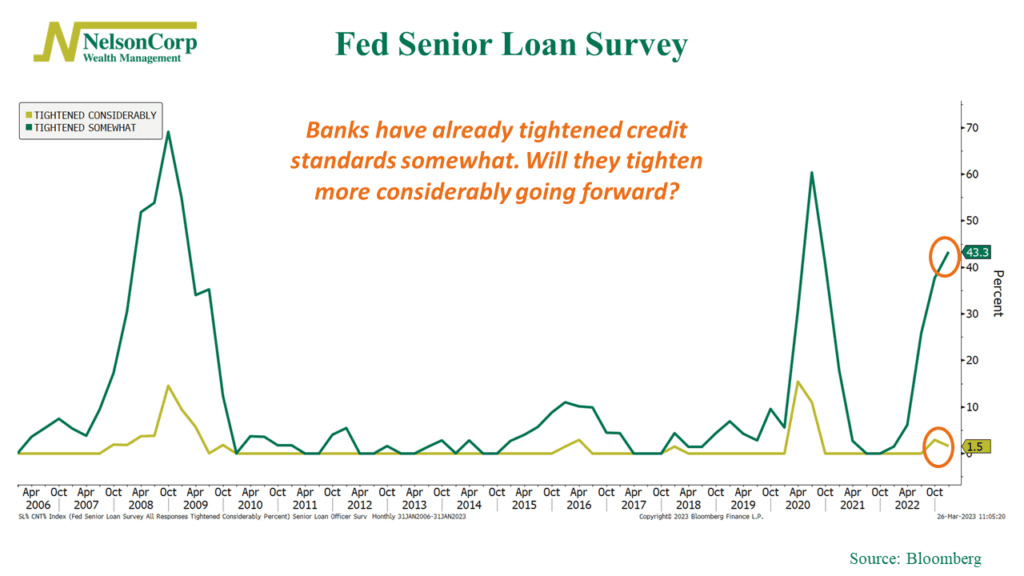
If they start to really ramp this up in the coming weeks and months, it could put a big damper on economic growth—and, potentially, stock prices.
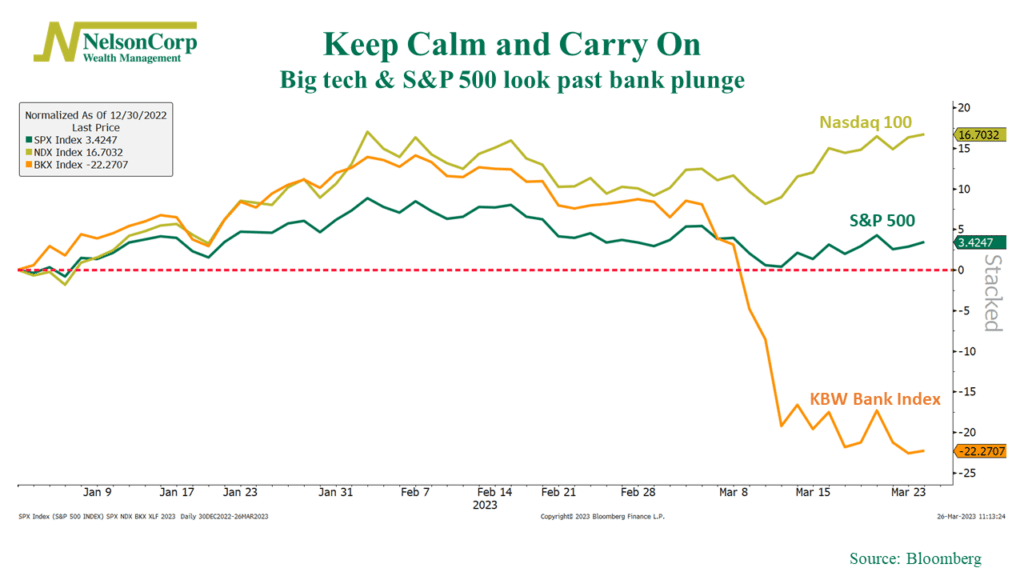
However, if we look at the stock market’s overall performance, the message is: Keep Calm and Carry On.
As the chart below shows, big tech and the broader market have seemingly shrugged off the recent banking worries, while an index of bank stocks has crumbled.
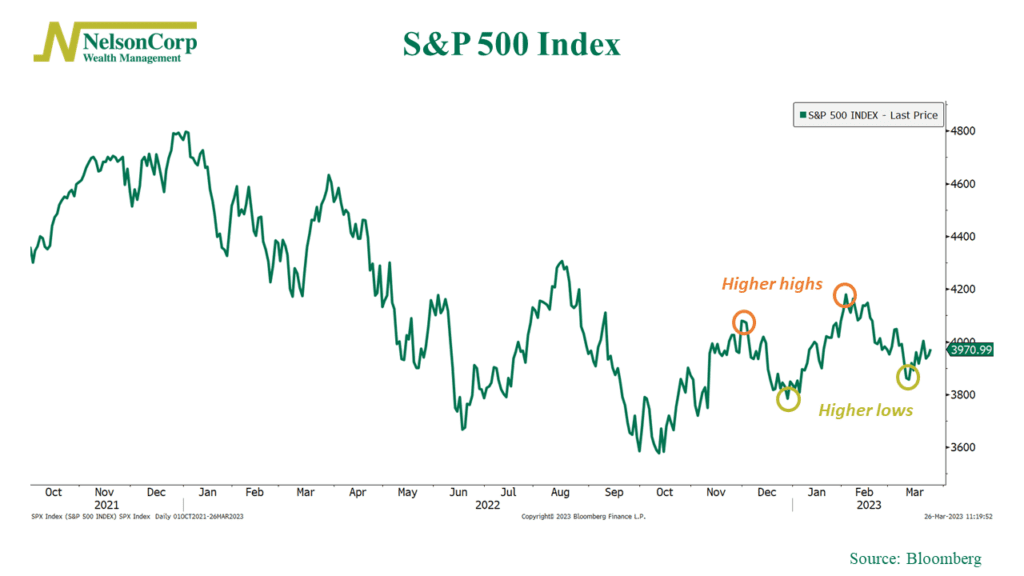
If we look at just the S&P 500’s performance, we see that the technical picture doesn’t look all that bad either.
While prices are down from the recent peak in February, the index has still managed to make a series of higher highs and higher lows since the October bottom—a sign of a market trying to establish an uptrend.
Turning our focus globally, it probably isn’t surprising that risk attitudes have shifted more “risk-off” in recent weeks, especially given the troubles at some globally systemic financial institutions.
However, as this next chart shows, this has yet to really happen to the extent one might have expected.
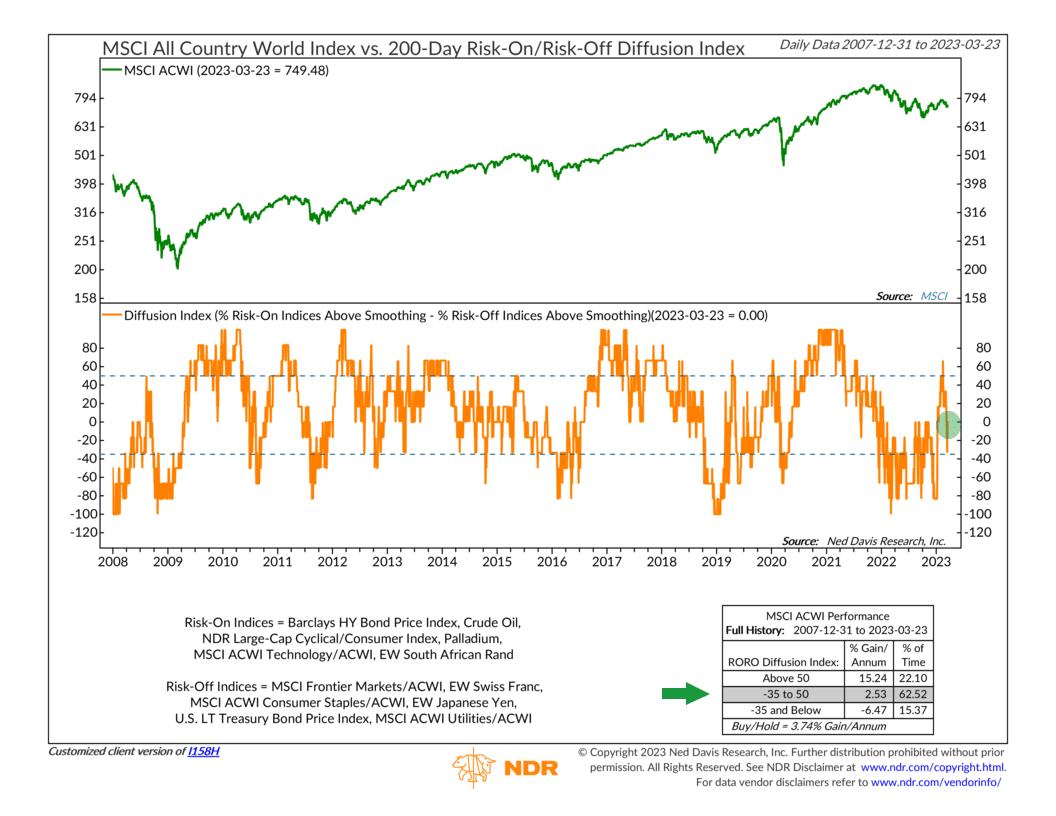
The 200-day smoothing of the Risk-On/Risk-Off Index—a measure of the relative risk tolerance in the investment landscape—remains in its neutral zone for stock prices.
In other words, we’d call the current environment “risk-neutral” right now.
Still, risk attitudes are much more cautious than a month and a half ago. And a lot of this has to do with the fact that global breadth has deteriorated substantially.
The percentage of the world’s stock markets trading above their average 50-day price—shown below—recently fell to under 10%.
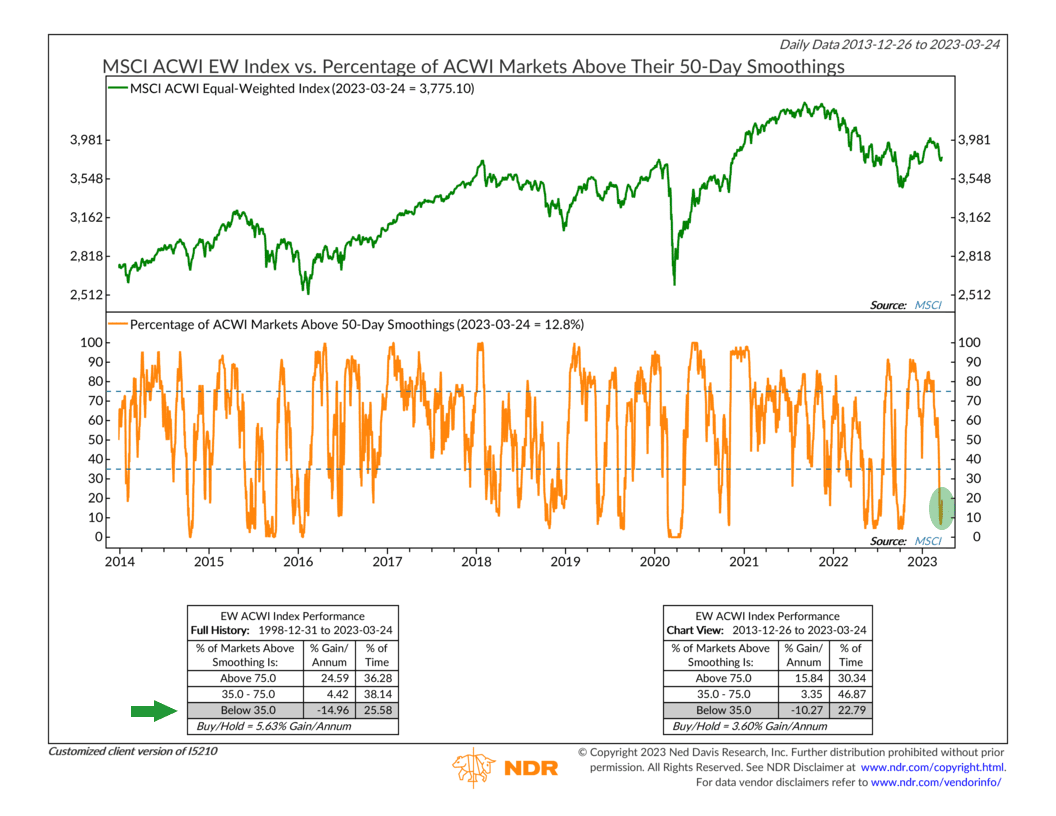
The potentially good news, however, is that this indicator is already starting to move higher. And the last time this indicator fell to these depths, the MSCI All-Country World Index—an index of global stocks—was at a lower price than it is today. In technical jargon, we call this a “bullish divergence,” and it’s a positive sign for stocks going forward.
The bottom line, therefore, is that the stock market appears to be down but not out.
Admittedly, it feels risky right now—with what seems like a new bank in trouble every day.
But overall, our modeling and the market’s price action suggest that the current environment leans primarily neutral.
In other words, now is a time to be cautious—but maybe not too cautious.
This is intended for informational purposes only and should not be used as the primary basis for an investment decision. Consult an advisor for your personal situation.
Indices mentioned are unmanaged, do not incur fees, and cannot be invested into directly.
Past performance does not guarantee future results.
The post Down but Not Out first appeared on NelsonCorp.com.