OVERVIEW
U.S. stocks edged higher last week, resulting in the S&P 500—up 0.21% for the week—reaching a new high for the year. The tech-heavy Nasdaq increased 0.7%, and the Dow remained flat.
Foreign stocks, however, were mixed. Developed countries rose 0.37%, whereas emerging markets fell 0.73%.
Bonds saw moderate price increases across the board, with the largest gain coming from long-term Treasuries—up 1.7%. The 10-year Treasury rate settled at 4.23% on Friday, up slightly from the previous week.
Commodities had a poor week—down 3.77% broadly—as oil prices dropped nearly 4%. Gold also fell around 3.6%. Corn, however, was up slightly by about 0.15%. And the U.S. dollar strengthened about 0.9% to end the week.
KEY CONSIDERATIONS
Cooling—But Still Hot – Last month, the stock market had its second-best November in more than 40 years.
This month, however, things have been calmer.
Looking at the chart of the S&P 500 Index below, we see that the bullish momentum that built up over the past month has started to wane a bit. The 14-day Relative Strength Index (RSI)—an indicator that measures momentum—is flashing a warning sign that the market is short-term overbought. The index itself is also bumping against resistance created by its year-to-date high set in July.
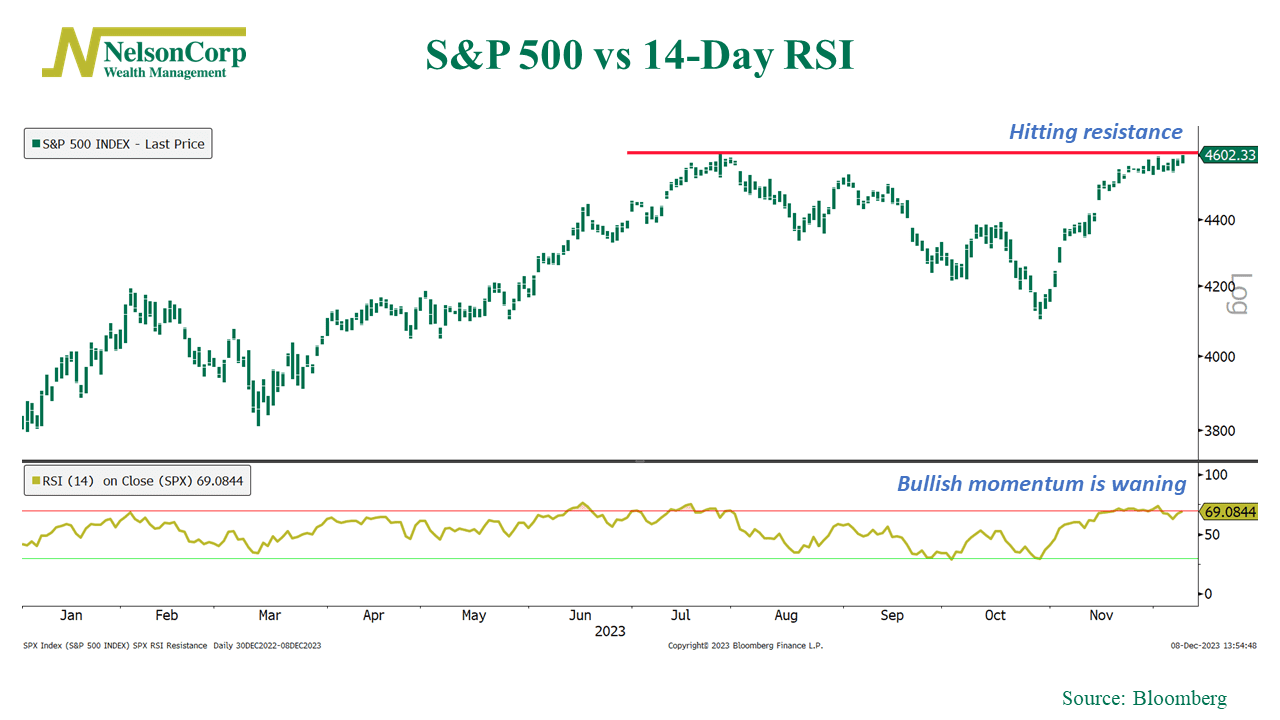
While these technical indicators aren’t outright bearish, they likely contribute to the more subdued returns we’ve witnessed this month.
Another factor could be the bond market, where the 5-year Treasury rate (shown below) recently tested its 200-day average price.
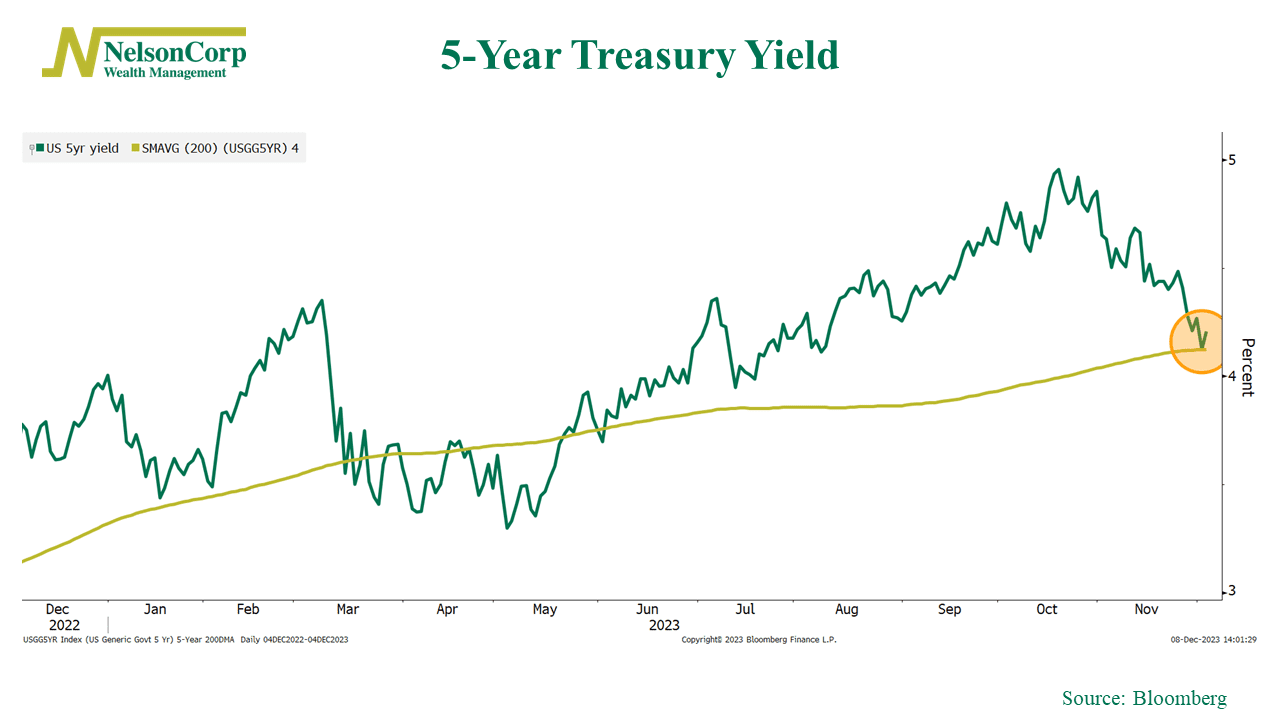
Given the stock market’s affinity for falling rates this year, it’s reasonable to expect a cooling-off period when rates stabilize like this.
However, if we zoom out, we still see evidence that the strong price action from last month continues to flow into and support the underlying trend of the market.
For example, the indicator below measures the S&P 500’s performance over the past 3 months and compares it to its average price over the past year. We call it a deviation-from-trend indicator because it measures the extent to which short-term prices are deviating from the long-term trend.
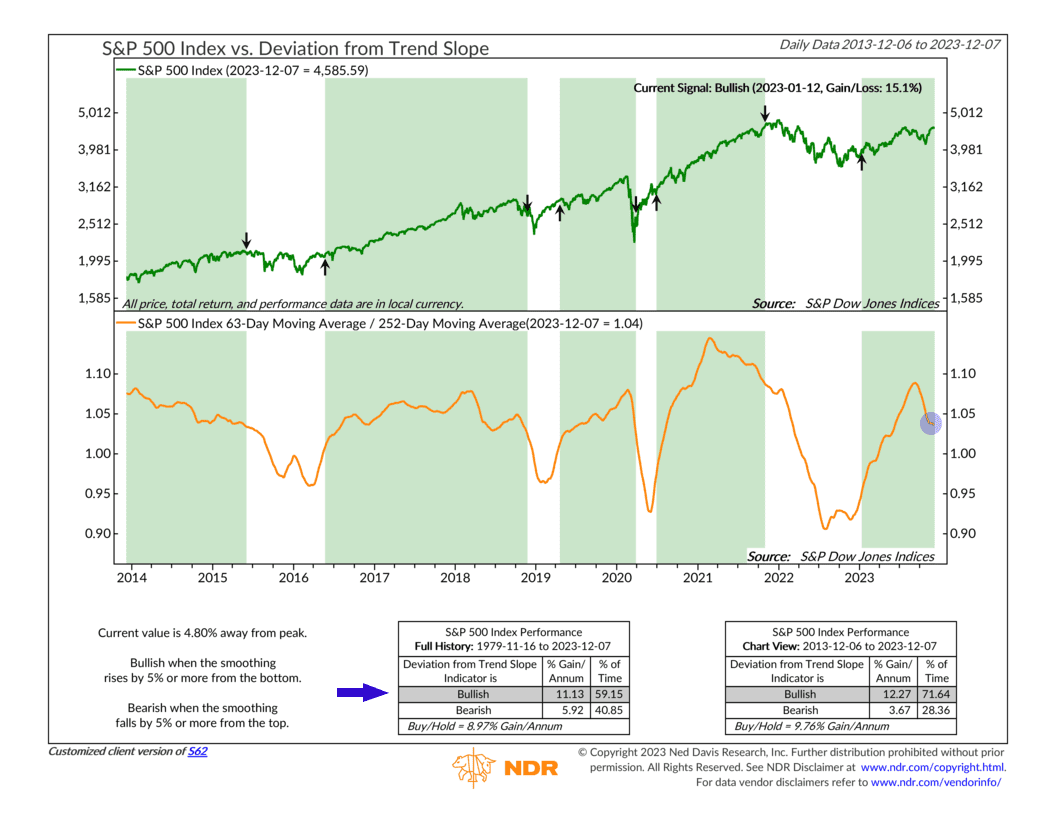
As you can see, it started declining rapidly a few months ago when the market fell into correction territory. However, the S&P 500’s quick reversal and strong follow-through price action has managed to flatten the metric out in recent weeks, preventing it from going negative.
In other words, we see this as a sign that the stock market’s trend remains intact, despite some short-term technical resistance.
Overall, this supports the weight of the indicator evidence, which continues to lean in a positive direction over the intermediate term.
This is intended for informational purposes only and should not be used as the primary basis for an investment decision. Consult an advisor for your personal situation.
Indices mentioned are unmanaged, do not incur fees, and cannot be invested into directly.
Past performance does not guarantee future results.
The S&P 500 Index, or Standard & Poor’s 500 Index, is a market-capitalization-weighted index of 500 leading publicly traded companies in the U.S.
The post Cooling–But Still Hot first appeared on NelsonCorp.com.