OVERVIEW
It was a mixed bag of results for U.S. stocks last week. The S&P rose 0.82%, the Nasdaq soared 2.26%, and the Dow fell 0.45%.
Growth stocks led the way, gaining 1.66%, whereas value stocks declined 0.25%. Small caps also fell about 0.4%.
It was a mixed bag for foreign stocks, as well. Developed country stocks declined 0.2%, and emerging markets gained 0.68%.
The potential for further rate hikes sent short-term U.S. Treasury bond yields higher, as the 2-year yield jumped to around 5.06%. That’s roughly equal to the year-to-date high reached in March. However, longer-term rates fell, resulting in a 0.17% gain for intermediate-term Treasury prices and a 1.5% gain for long-term Treasury prices.
The price of U.S. crude oil fell for the second week in a row, but commodities still managed to gain about 1.18% broadly. Gold increased 1.22%. Real estate rose 0.62%, and the U.S. dollar strengthened about 0.83%.
KEY CONSIDERATIONS
Choppy – Last week was pretty choppy for the U.S. stock market. As the chart below shows, it was an “up one day, down the next day” type of week for the S&P 500.
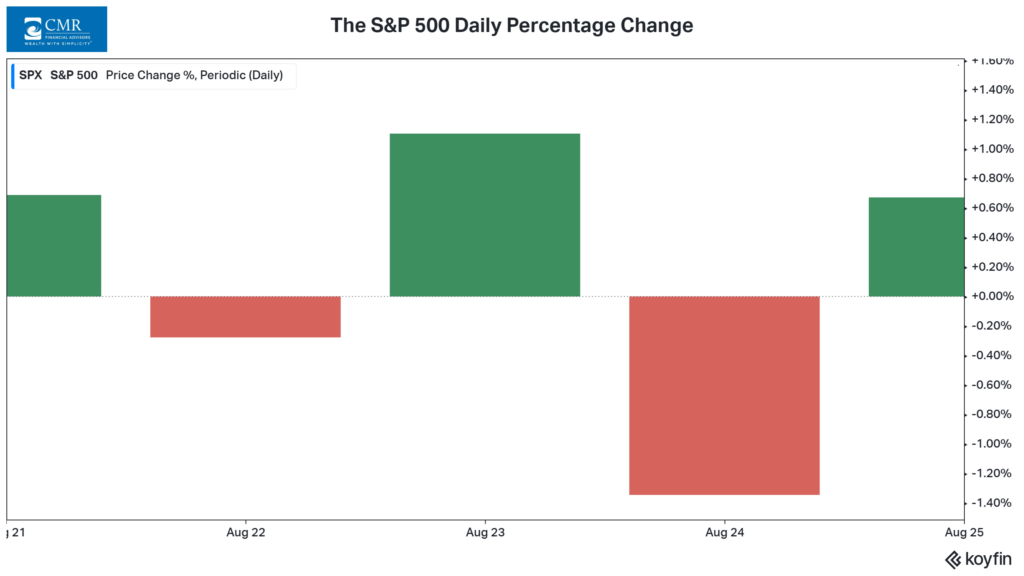
Rising rates. Corporate earnings. Fed Chair Jerome Powell speaking at Jackson Hole. There is no shortage of risks out there for investors to digest. Choppiness is to be expected.
If we zoom out a bit on the S&P 500’s price chart, we also see that the stock market is trading in “no man’s land” at the moment. By that, I mean that the index’s current level is below its average 50-day price (blue dashed line) but above its average 200-day price (orange dashed line).
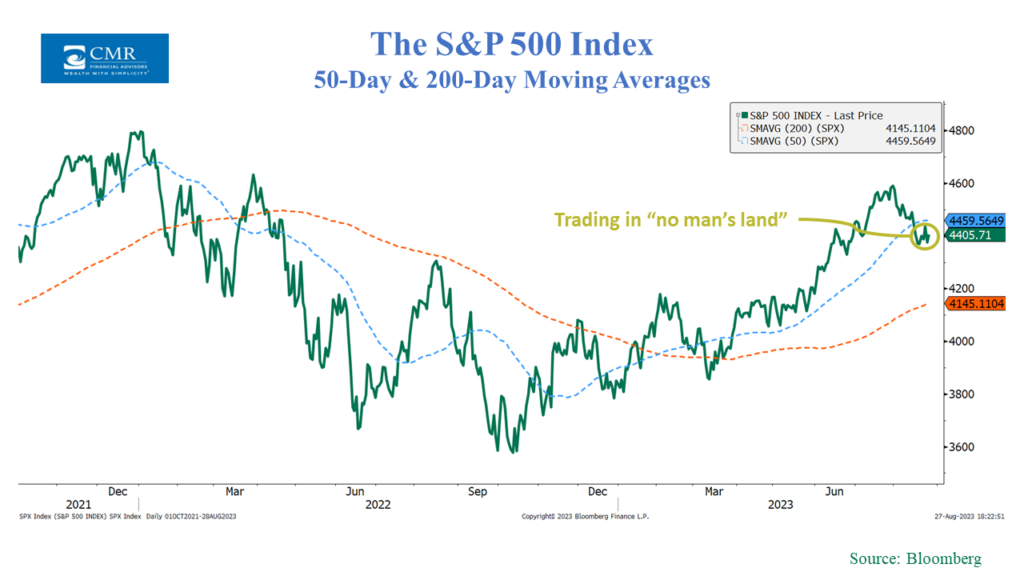
It will be important to keep an eye on where the market decides to go from here. The longer-term trend—the 200-day moving average—is still rising, which is a bullish sign longer-term. However, if we see the 50-day moving average roll over and start to close the gap with the 200-day moving average, it could put a lot of pressure on the market.
One of the indicators that we’ll be watching is Momentum Reversals, shown below. This indicator looks at the S&P 500’s 1-year rate-of-change and compares it to its historical 3-month trading range to determine whether momentum is reversing.
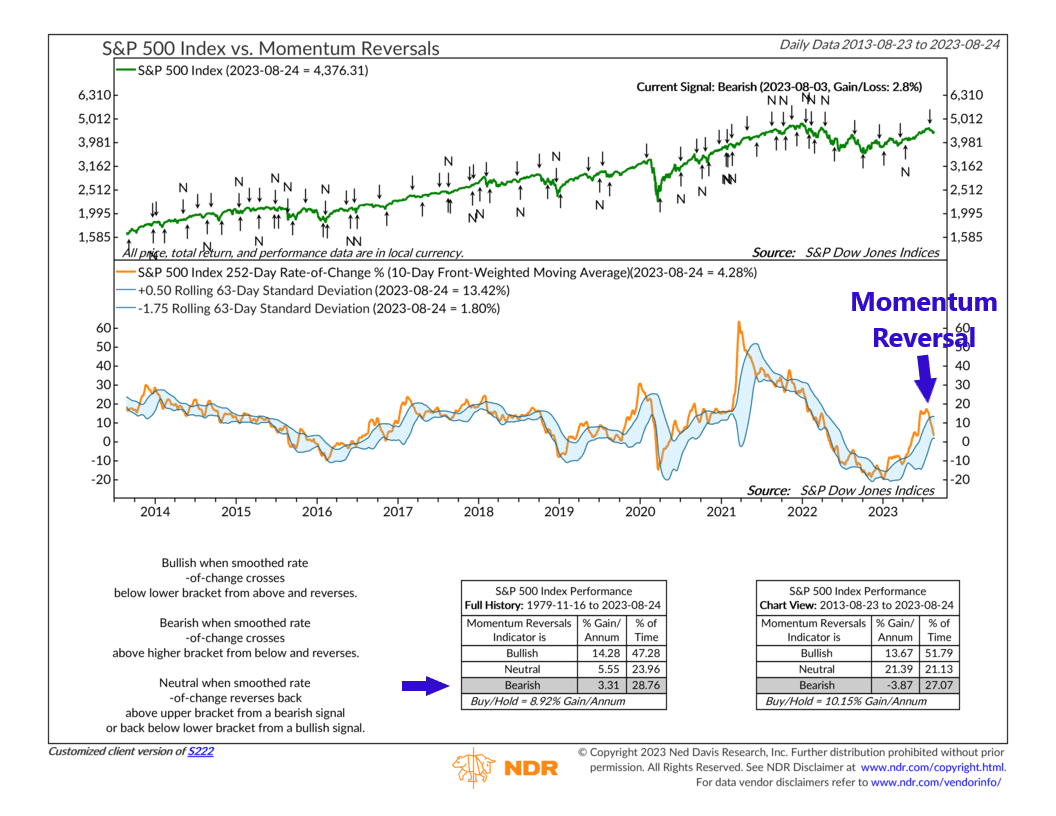
For example, at the beginning of August, the S&P 500’s 1-year rate-of-change fell below its upper standard deviation line, triggering a negative signal. This was a sign that stock price momentum had slowed—and stocks have struggled since.
Looking ahead, though, we can see that the indicator is currently at the lower end of its range. If it can fall below the lower band and then reverse back above it, it would trigger a positive momentum reversal signal for stocks.
At that point, it would be helpful to see improvement in some of our other non-price-based indicators to confirm that the weight of the evidence is improving.
For example, our Overbought/Oversold composite model, shown below, remains in overbought (negative) territory.
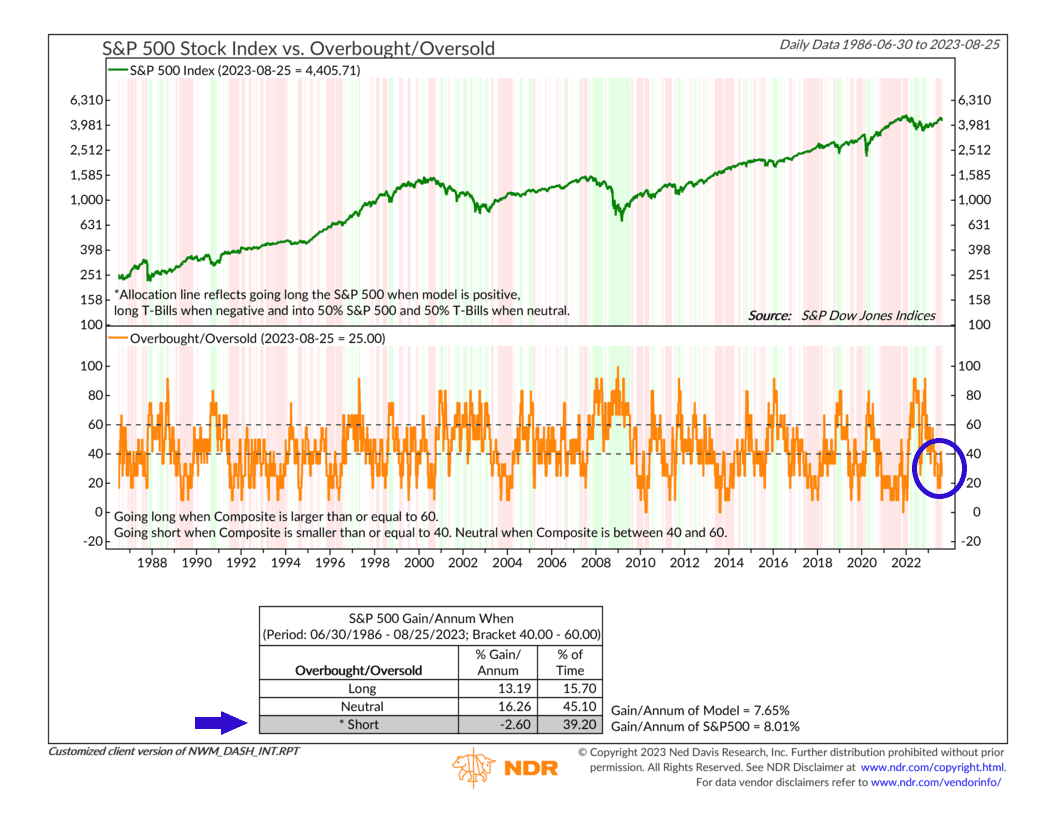
If we can see some of these overbought conditions relieved—alongside a reversal in momentum—that would go a long way toward reversing the recent downtrend in stocks.
This is intended for informational purposes only and should not be used as the primary basis for an investment decision. Consult an advisor for your personal situation.
Indices mentioned are unmanaged, do not incur fees, and cannot be invested into directly.
Past performance does not guarantee future results.
The post Choppy first appeared on NelsonCorp.com.