OVERVIEW
The rally continued on Wall Street last week. In the U.S., small caps led the way as the Russell 2000 Index surged 5.4%. The S&P 500 Index rose 2.2%, the Dow Jones Industrial Average gained 1.9%, and the Nasdaq Composite increased 2.4%.
It wasn’t just the U.S. – international markets had a fantastic week, too. Developed countries’ stock markets increased by 4.4%, and emerging markets gained a solid 3%.
Bonds had their moment in the spotlight as well. The 10-year Treasury rate went down to 4.4%, giving intermediate-term treasuries a nice 1.5% boost and long-dated Treasuries an even better 2.4% increase.
Real estate had a standout performance, enjoying a robust 4.7% gain. On the flip side, the U.S. dollar declined about 1.8%. In the world of commodities, there was a slight overall dip of about 0.25%. Gold shone with a 2.6% increase, corn prices were up by 1.9%, but oil fell 1.4%.
KEY CONSIDERATIONS
Bunny Rally – Thanksgiving is here, but the stock market is in more of an Easter mood at the moment. Last week, the S&P 500 Index managed to “hop” over its downward diagonal trend line like a little white Easter bunny.
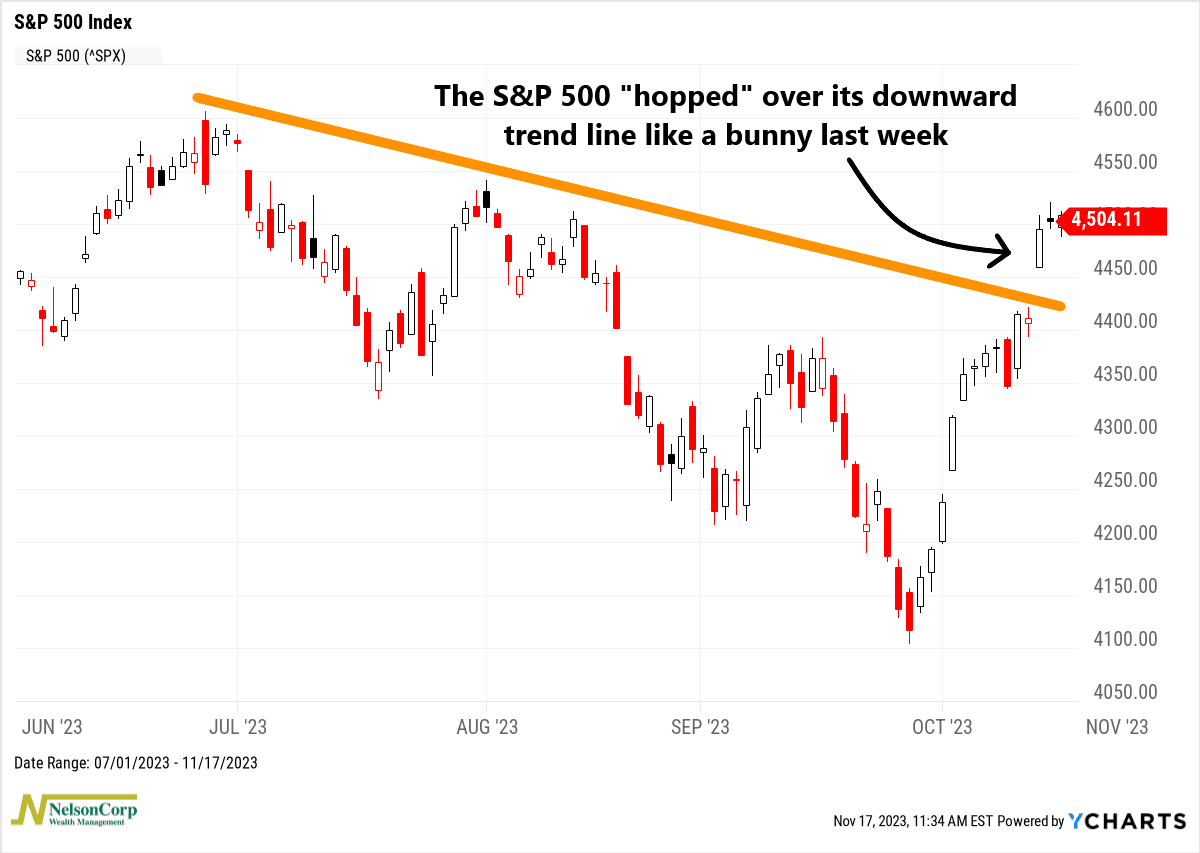
The market’s mood has changed dramatically in just a few weeks. In late October, the S&P 500 fell eight times in nine trading sessions. After that, it rallied eight days in a row—and it’s continued to rally ever since. The Index is currently at an 11-week high.
One major reason for this turn of events is the fact that investors are now convinced that the Federal Reserve is done hiking rates this cycle. As the chart below shows, the market is pricing zero rate hikes into the current forward-curve structure for the Fed Funds rate.
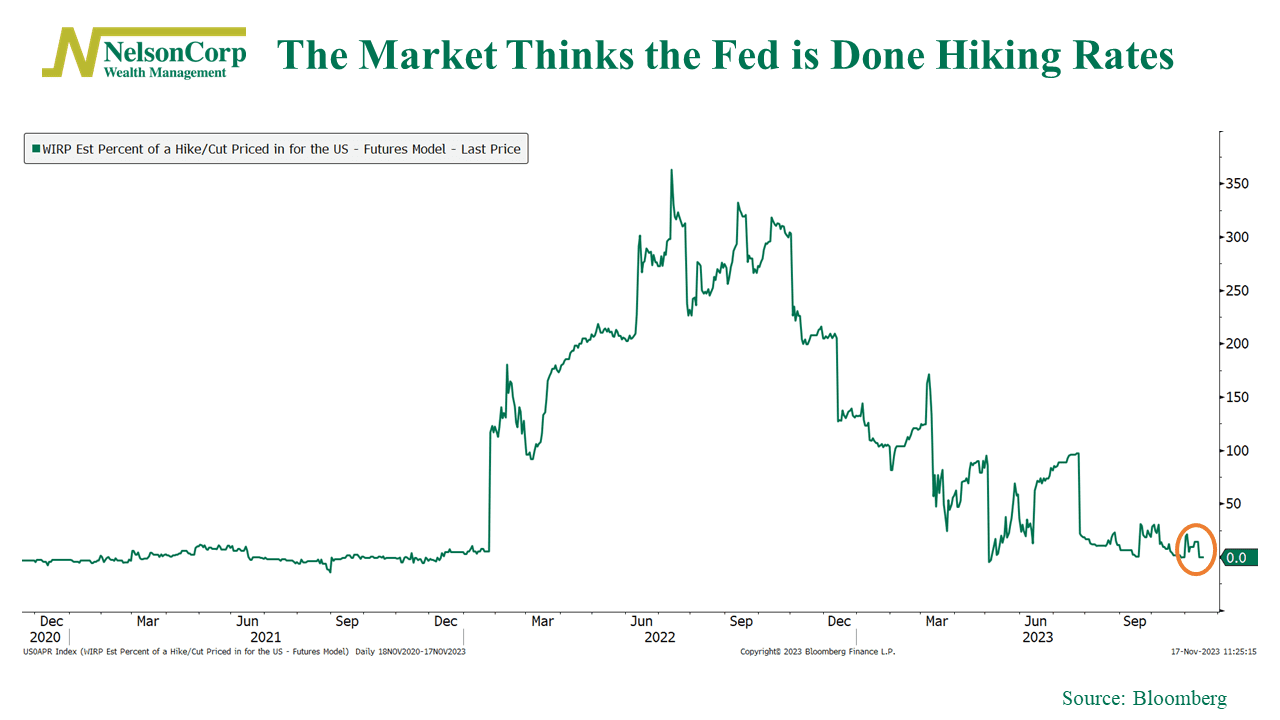
In fact, investors now expect the Fed to start cutting rates in less than six months. But is that because they suspect a recession is on the way?
Maybe. Maybe not. But, according to high-yield credit spreads, the answer is no.
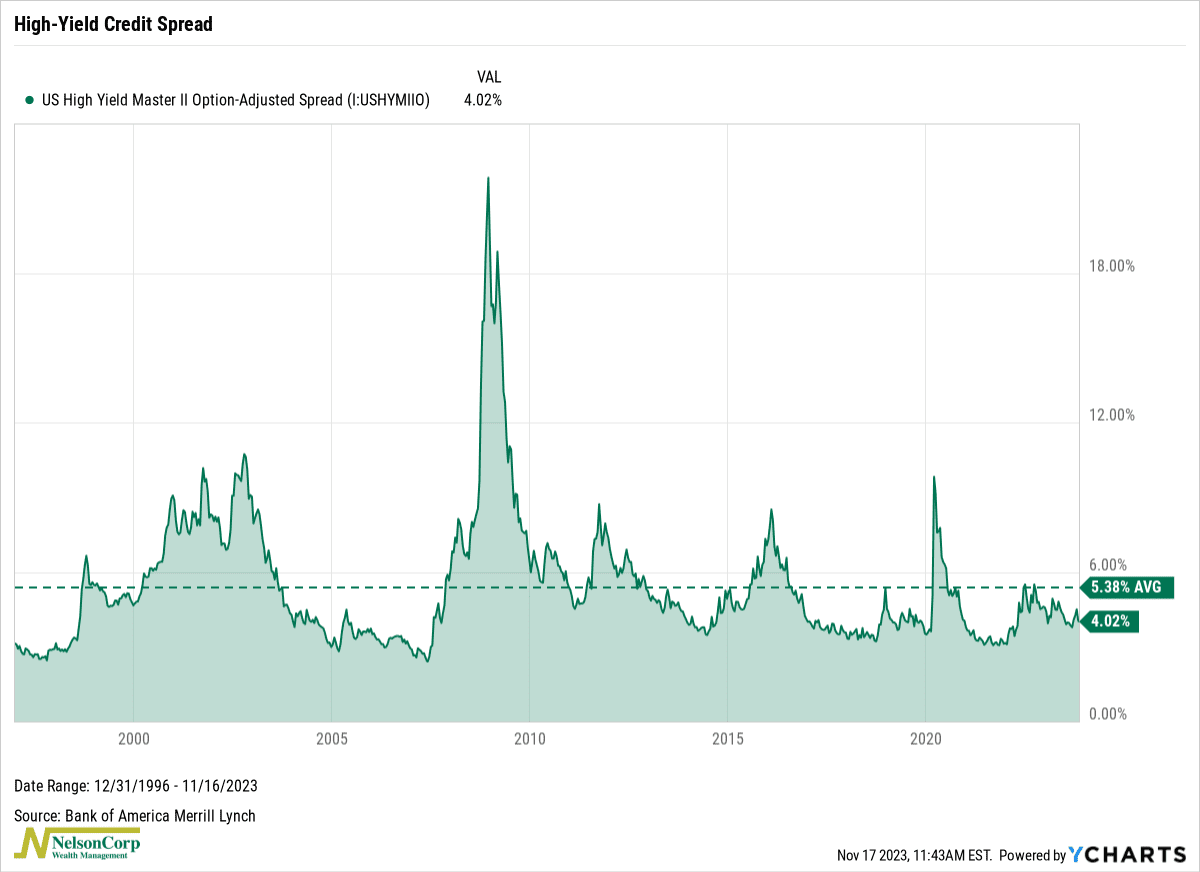
The chart above shows the difference in yield between high-yield (junk) bonds and safe 10-year Treasury notes. During times of high economic uncertainty, this spread tends to widen because investors flock to the safety of Treasuries (sending those yields lower) and sell risky junk bonds (sending those yields higher). The fact that the spread is currently 4% (below its 5.4% long-run average) and trending lower is a good sign for equity markets.
Another positive sign is that we’ve seen breadth improve in recent weeks. A little less than a month ago, only 25% of the stocks in the S&P 500 were trading above their long-term trend (their 200-day average price). Fast forward to today, however, and that number has jumped to more than 50%.
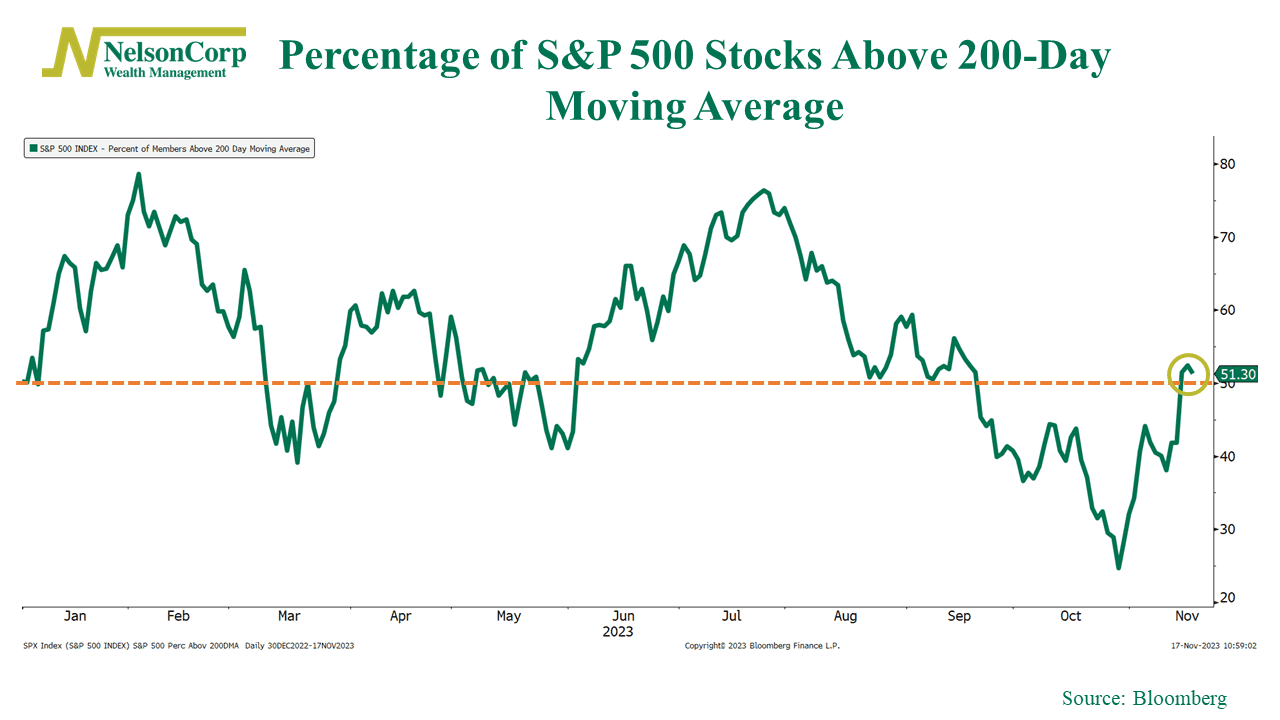
This is an encouraging sign. But if we look at breadth in a slightly different way, we see that the stock market remains very top-heavy. By that, I mean that a handful of massively sized companies are responsible for most of the stock market’s return this year.
For example, the chart below shows that the percentage of S&P 500 stocks outperforming the S&P 500 Index is just 26%. That’s the lowest percentage since 1998.
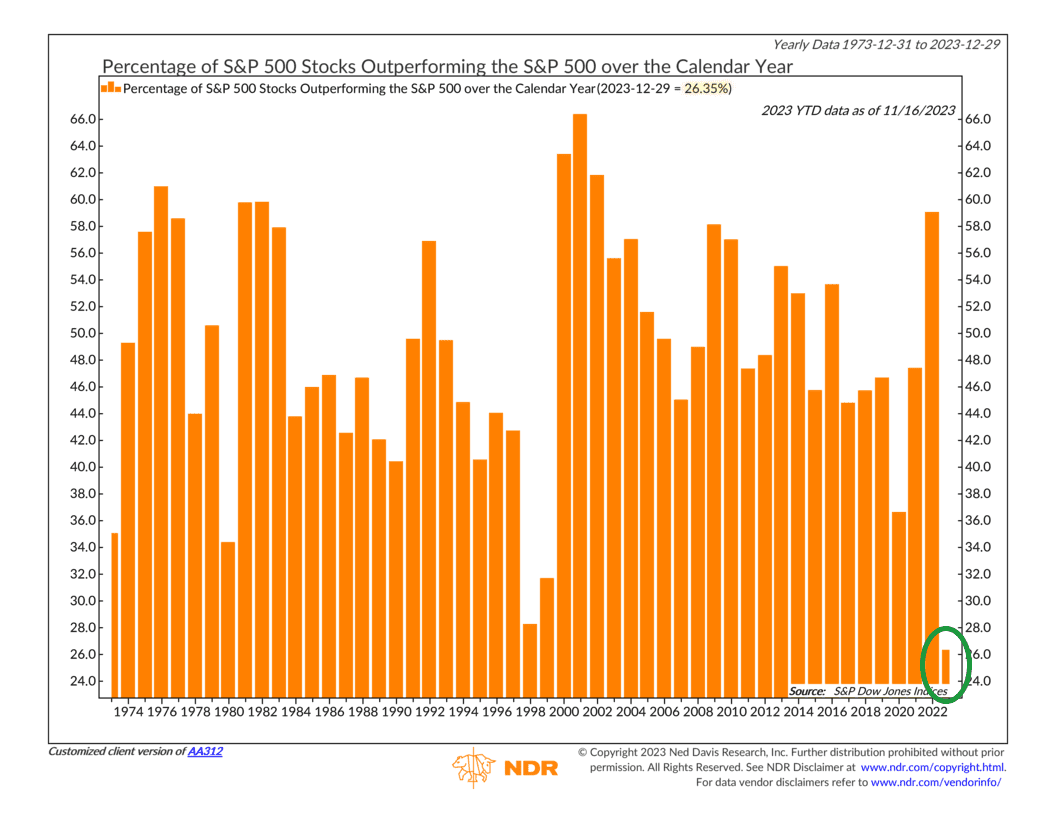
Of course, this doesn’t mean you should avoid stocks altogether- quite the opposite, actually. However, given the current market landscape, a prudent and tactical approach to investing might be wise.
This is intended for informational purposes only and should not be used as the primary basis for an investment decision. Consult an advisor for your personal situation.
Indices mentioned are unmanaged, do not incur fees, and cannot be invested into directly.
Past performance does not guarantee future results.
The S&P 500 Index, or Standard & Poor’s 500 Index, is a market-capitalization-weighted index of 500 leading publicly traded companies in the U.S.
The post Bunny Rally first appeared on NelsonCorp.com.