OVERVIEW
The U.S. stock market dipped for a second consecutive week. The S&P 500 fell 1.56%, the Nasdaq dropped 0.45%, and the Dow declined 2.37%. Small caps brought up the rear, down nearly 3% for the week.
Over in foreign markets, we saw declines of about 1.2% for developed country stock markets and a 0.4% drop for emerging markets.
Bonds struggled, too. The benchmark 10-year yield rose to 4.53%, resulting in a 0.7% drop in intermediate-term Treasury prices and a 1.2% drop in long-term Treasuries.
Commodities, on the other hand, were roughly flat for the week. While oil dipped about 1.06%, gold increased 1.22%, and corn prices rose 1.22%. Real estate suffered declines of around 2.7%, and the U.S. dollar strengthened about 1.8%.
KEY CONSIDERATIONS
Bull Market Checklist – Stocks took a hit last week after the release of a surprisingly strong inflation report. Overall, the U.S. market was down around 1.5%.
The reaction wasn’t all that surprising. What was more surprising was the previous five months of seemingly calm, steady gains. The stock market was bound to get shaken up by something eventually.
But, after it’s all said and done, the bull market is still behaving like a bull market.
How do we know? We like to focus on the “weight of the evidence” when measuring this type of thing. I like to think of it as a checklist for the bull market. The more checks there are, the better the environment. And right now, the market is still checking off a lot of boxes.
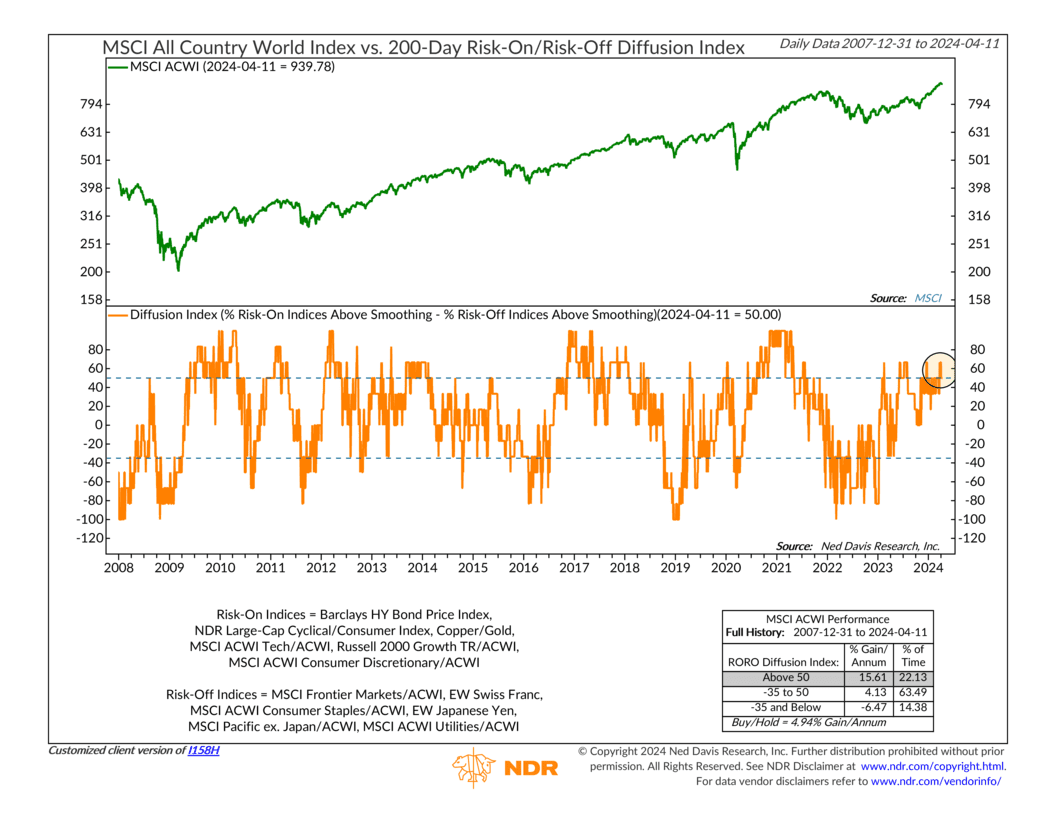
For example, investors clearly have a “risk-on” type of attitude at the moment. The percentage of market indices in uptrends positively correlated with risk-taking behavior is currently about 50%, compared to 0% of the indices associated with “risk-off” behavior. That places the Risk-On/Risk-Off ratio, shown below, in a bullish zone for stock gains.
As for the S&P 500 Index, it remains in a bullish uptrend, currently trading more than 9% above its 200-day moving average (which also continues to point upwards itself).
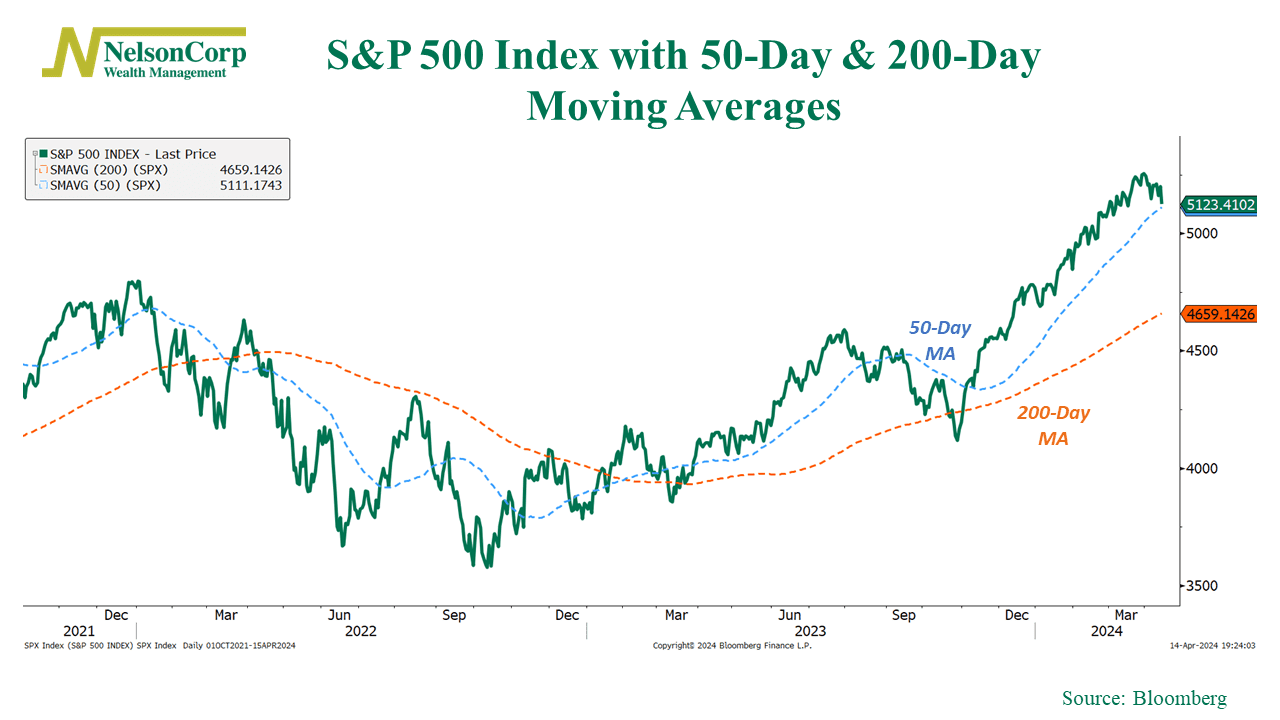
However, as you can also see, the S&P 500 has fallen to its 50-day moving average for the first time in five months. This will be something to keep an eye on, as it could lead to more weakness if left unchecked.
Overall, though, the majority of check marks remain bullish. More than 70% of global stock markets are in uptrends (above their average 50-day price), measures of financial stress remain low, and corporate bond yields remain tight relative to Treasuries.
We did, however, see a breakdown in new-high breadth last week. For more than 100 straight days, the number of stocks in the S&P 500 Index making new highs was greater than the number making new lows. Unfortunately, we saw this turn negative last week, as shown below.
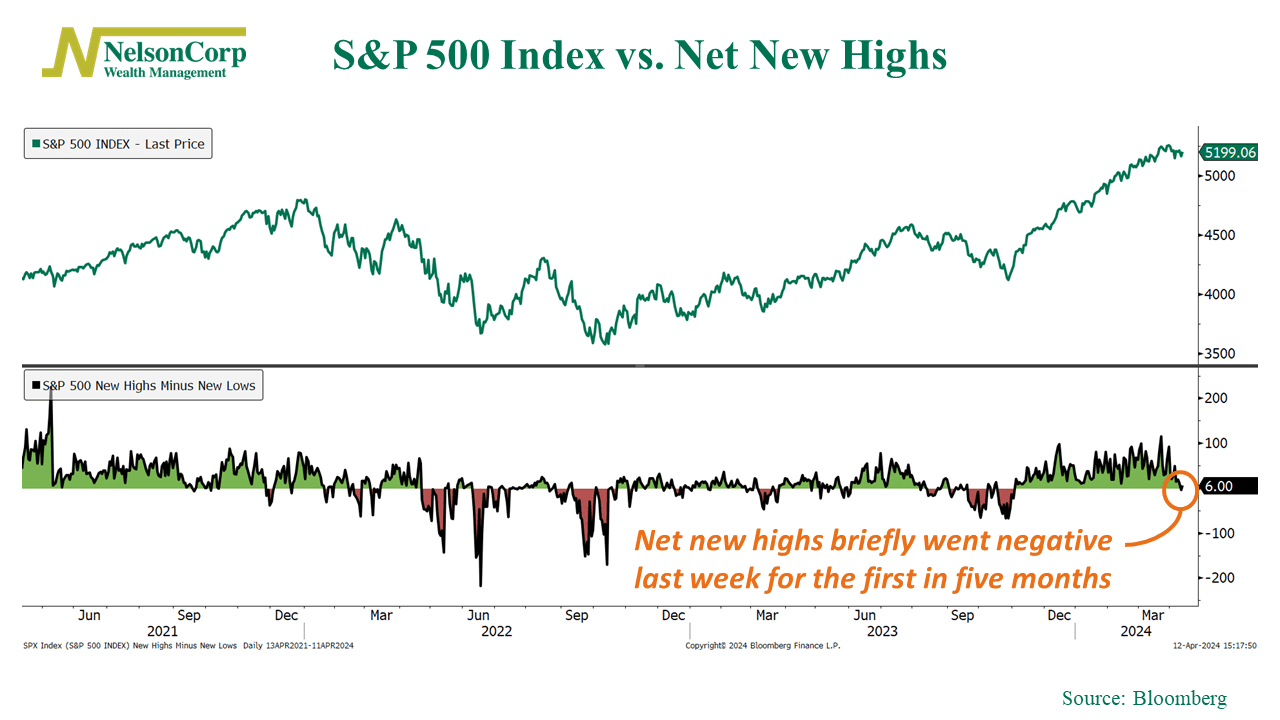
The good news, though, is that it just barely went negative. We’ll need to watch this in the coming weeks to see if it worsens.
The bottom line, however, is that while there are some key areas to watch, the overall picture suggests that the bull market remains intact and favorable for stocks.
This is intended for informational purposes only and should not be used as the primary basis for an investment decision. Consult an advisor for your personal situation.
Indices mentioned are unmanaged, do not incur fees, and cannot be invested into directly.
Past performance does not guarantee future results.
The S&P 500 Index, or Standard & Poor’s 500 Index, is a market-capitalization-weighted index of 500 leading publicly traded companies in the U.S.
The post Bull Market Checklist first appeared on NelsonCorp.com.