OVERVIEW
The major U.S. stock indices climbed around 2% to 3% last week, regaining ground lost in the previous week. The S&P 500 rose 2.42%, and the Nasdaq surged 3.32%, marking a 15-month high for both indices.
Overseas, returns were even better, with developed country stocks increasing 4.85% and emerging markets gaining 4.88%.
Overall, investors felt calm, as the Cboe Volatility Index—the VIX—fell roughly 10% for the week. This coincided with an indicator that tracks U.S. consumer sentiment rising to its highest level since September 2021.
The mid-week inflation report came in cooler than expected, which helped ease concerns about the pace of further interest-rate increases. The previous week’s sharp rise in government bond yields reversed course as a result. The 10-year U.S. Treasury note’s yield dropped to 3.82%, and the 2-year note’s yield fell to 4.73%.
Over in the real asset space, real estate gained 2.87%, and commodities rose 2.63% broadly. Oil prices—up about 2.5%—climbed for the third week in a row. Gold also surged around 3.6%. And finally, the U.S. dollar dipped about 2.16%.
Retail sales will be on the docket for the coming week. The Tuesday release will tell us if the positive momentum from April and May extended into June.
KEY CONSIDERATIONS
Broadening Out – One of the defining features of the stock market in 2023 has been its narrow leadership. In other words, just a handful of big, mega-cap stocks have accounted for most of the year’s gains.
Indeed, as the chart below shows, the tech sector’s outperformance has been quite dramatic.
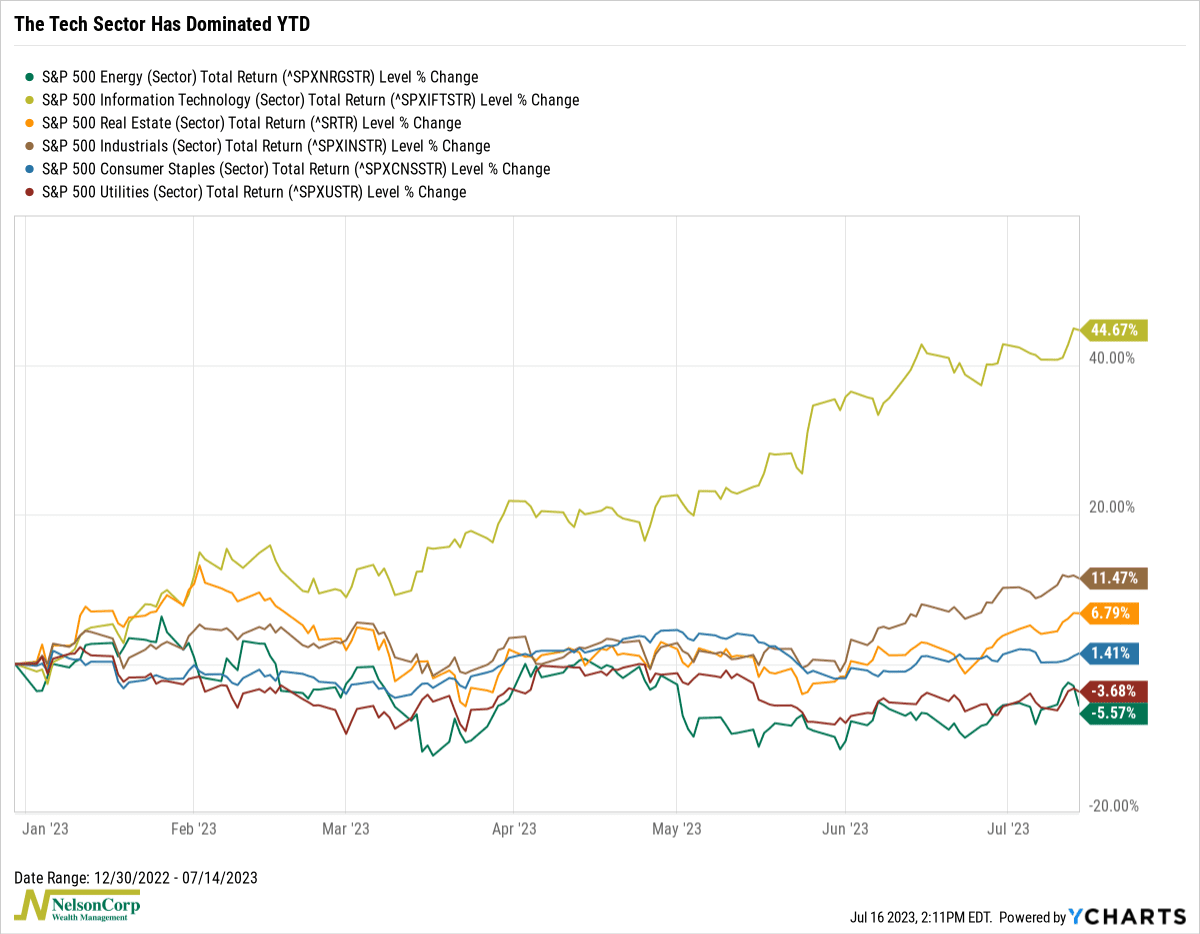
But, with that said, we are starting to see some signs that the market’s breadth is improving.
For one, materials and energy stocks have all been leading the S&P 500 since early June—financials too. Since these tend to be economically sensitive market sectors, we could interpret this as a sign that investors are growing skeptical of an imminent recession.
This is backed up by the following chart showing the relative strength of the S&P 500 Transports Index.
![]()
Interestingly enough, it also shot straight up near the beginning of June. This is a sign that investors want to own the stocks of companies that move goods around the country, which is the type of activity you tend to see when the economy is—or expected to be—strong.
As for the stock market overall, we are seeing some concrete evidence that the majority of individual stocks in the market are performing well compared to their recent past.
For example, the indicator below measures the percentage of stocks trading above their average 200-day price. This is a common way of measuring what I have been calling “breadth” in the market.
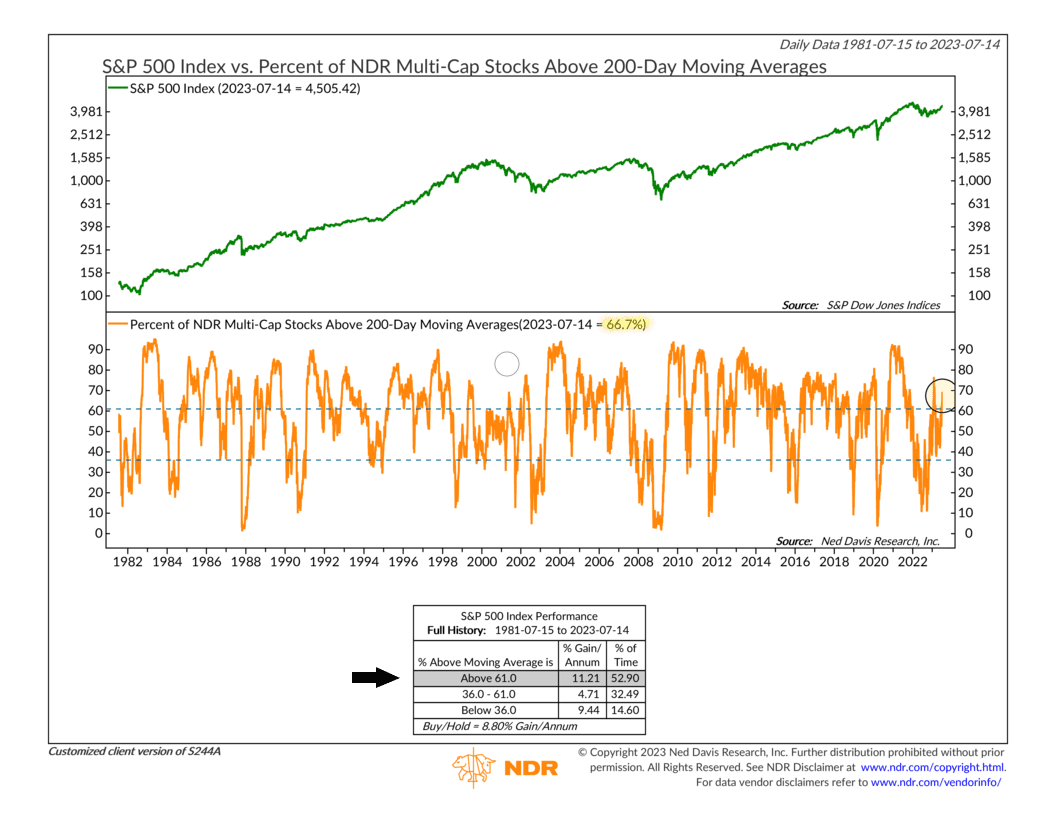
As you can see, it’s now up to roughly 70%—meaning 70% of the stocks in the market are trading at prices today that are higher than their average price over the past 200 trading days. That places the indicator in its upper bullish zone, which, historically, has resulted in solid annualized gains for the S&P 500 Index.
So, what’s the overall message? Well, if you were to wrap this all up into one neat little package, you might get something that looks like the following chart. We call this our Participation Model, which does just what its name implies—it measures participation (or breadth) in the stock market.
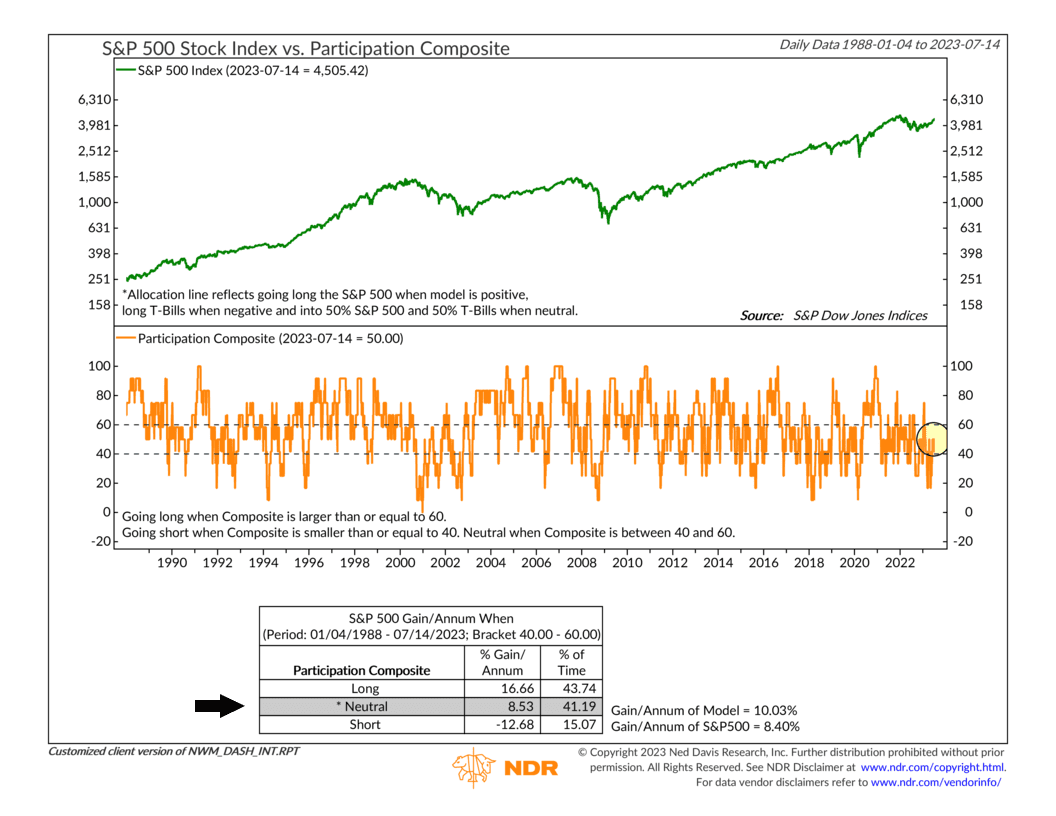
Right now, the reading of the model is 50%—meaning the model is in its neutral zone. Compared to the lows in March and May, that’s a pretty good improvement. But, as you can see, there’s still more room for progress.
The bottom line? We’ll be watching to see if we can get more participation in the weeks and months ahead to add further weight to the bullish side of the ledger.
This is intended for informational purposes only and should not be used as the primary basis for an investment decision. Consult an advisor for your personal situation.
Indices mentioned are unmanaged, do not incur fees, and cannot be invested into directly.
Past performance does not guarantee future results.
The post Broadening Out first appeared on NelsonCorp.com.