OVERVIEW
The U.S. stock market is once again trading near all-time highs after notching a solid week of performance last week. The S&P 500 rose 1.64%, the Dow gained 1.08%, and the Nasdaq increased 1.29%.
Growth stocks had a slight edge, up 1.78%, versus the 1.52% gain for value stocks. Small-cap stocks were up 1.26%, which was slightly better than the 1.23% gain for large-cap stocks.
Foreign stocks were also up but to a lesser degree. Developed country stocks rose 0.61%, and emerging markets gained 0.74%.
The 10-year Treasury yield rose to 1.63% last week, resulting in lower bond prices. Long-term Treasuries fell 0.81%, investment-grade corporate bonds fell 0.48%, high yield (junk) bonds fell 0.08%, and municipal bonds dropped 0.31%. TIPS, however, notched a 0.16% gain for the week.
Real estate had a big week, gaining 2.5%. Commodities were more mixed, with the broad index down around 0.93%, but oil, gold, and corn all up for the week. The U.S. dollar weakened by about 0.32% to end the week.
KEY CONSIDERATIONS
Brimming With Punch – The longest-serving Federal Reserve chairman in U.S. history was William McChesney Martin, having served from 1951 to 1970. But he’s perhaps more famous for his unique view on the Fed’s role as a monetary authority. The Fed, he said, should act like a “chaperone who has ordered the punchbowl removed just when the party was really warming up.”
He was referring to the Fed preemptively tightening monetary policy when it spots signs of excess in the economy. But the punchbowl metaphor has stuck around and is still synonymous with how much liquidity the Fed is allowing to slosh around the financial system.
We’ve talked before about the liquidity-provider role the U.S. Fed and the Treasury has played in this most recent economic crisis. It’s been a big reason why stocks did so well after that initial correction back in March 2020. Here’s another chart that shows just how substantial the stimulus has been:
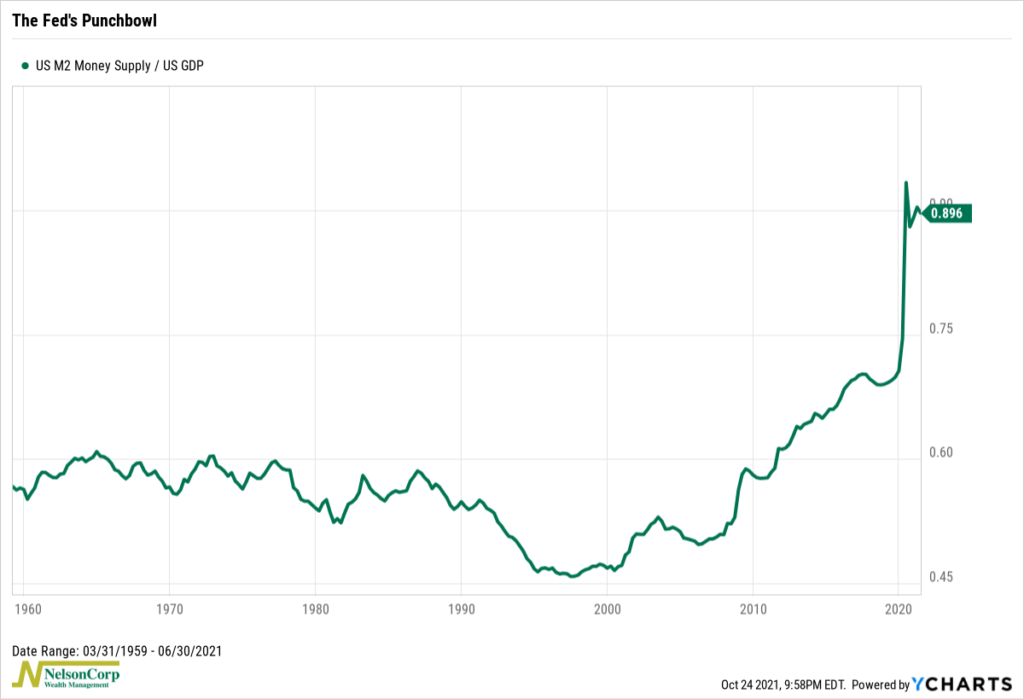
This chart is the ratio of the M2 money supply to the United States’ GDP. In other words, it shows how much money there is in the economy relative to the size of the economy itself. As you can see, it’s been hovering around a record-high 90% for the past five quarters. Said differently, the M2 money supply is equivalent to almost a year’s worth of nominal GDP.
That’s a lot of liquidity! I think it’s safe to say the Fed’s punch bowl remains full, brimming with punch. So, it’s not surprising that stocks are once again trading near all-time highs when viewed through this lens.
Going forward, however, the question is, how long will all that liquidity last? Market-based inflation expectations hit their highest levels ever this past week (note: breakeven inflation data goes back to 2003). And the Fed has already hinted that it might be time to start removing some punch from the proverbial punchbowl.
All that could mean liquidity will be less of a tailwind for the stock market in the future, especially if fiscal policy (spending by the federal government) becomes less stimulative in the coming years.
This is intended for informational purposes only and should not be used as the primary basis for an investment decision. Consult an advisor for your personal situation.
Indices mentioned are unmanaged, do not incur fees, and cannot be invested into directly.
Past performance does not guarantee future results.
The post Brimming With Punch first appeared on NelsonCorp.com.