OVERVIEW
The U.S. stock market is officially back to new all-time highs after last week. The S&P 500 index rose 1.17%, setting a new record high for the first time since January 2022. The Dow Jones Industrial Average also set a record high after climbing 0.7%. The Nasdaq Composite popped 2.3%.
In terms of stock categories, growth stocks took the lead with a 2.1% climb, while value stocks experienced a slight decline of 0.23%. Among market capitalizations, large-cap stocks showed a positive trend with a 1.6% increase, contrasting with a relatively flat performance for small-cap stocks.
However, foreign stocks faced challenges during the week, with developed country markets falling by 2.14% and emerging markets experiencing a drop of 2.55%.
The bond market had a challenging week, marked by a rise in the 10-year Treasury rate to 4.13%. Intermediate-term Treasuries declined by 1%, and long-term Treasuries fell approximately 2.5%. Investment-grade corporate bonds also saw a decrease of around 1%.
Real assets did not perform much better, as real estate witnessed a 1.9% decline, and commodities, in general, dropped by 1.18%. While oil prices increased by 1.18%, gold experienced a 1.1% decline, and corn declined by 0.34%. On the currency front, the U.S. dollar strengthened, appreciating by about 0.9%.
KEY CONSIDERATIONS
Balancing Act – Investing is like a balancing act.
You might have some positive indicators on one side of the scale; on the other, there are some negative ones. The goal is to figure out how to balance the two sides and determine which direction the weight of the evidence is leaning.
Right now, for example, the positive side is filled with signs of a resilient U.S. consumer and increased earnings momentum for the stock market.
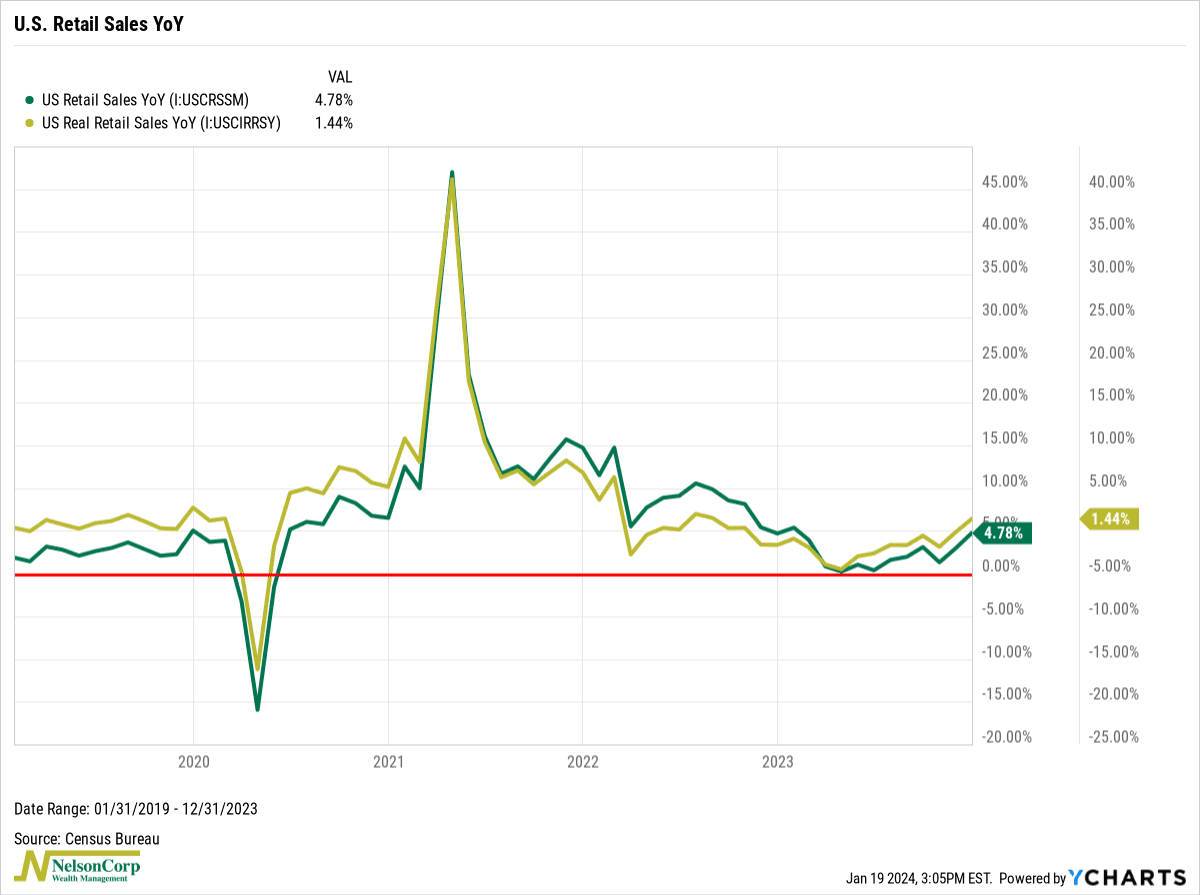
For instance, here’s the year-over-year change in nominal and real (inflation-adjusted) retail sales in the United States. Both have been trending higher since the spring of 2023, a sign that the American consumer keeps doing what it does best: spend.
All that spending has translated into an uptick in anticipated earnings momentum for the stock market. The middle clip in the chart below shows that the year-over-year change in S&P 500 earnings-per-share (EPS) growth bottomed out at -12.7% at the end of 2022 and has since rebounded to -1.5%. It is expected to continue in 2024 at a 12.8% growth rate.
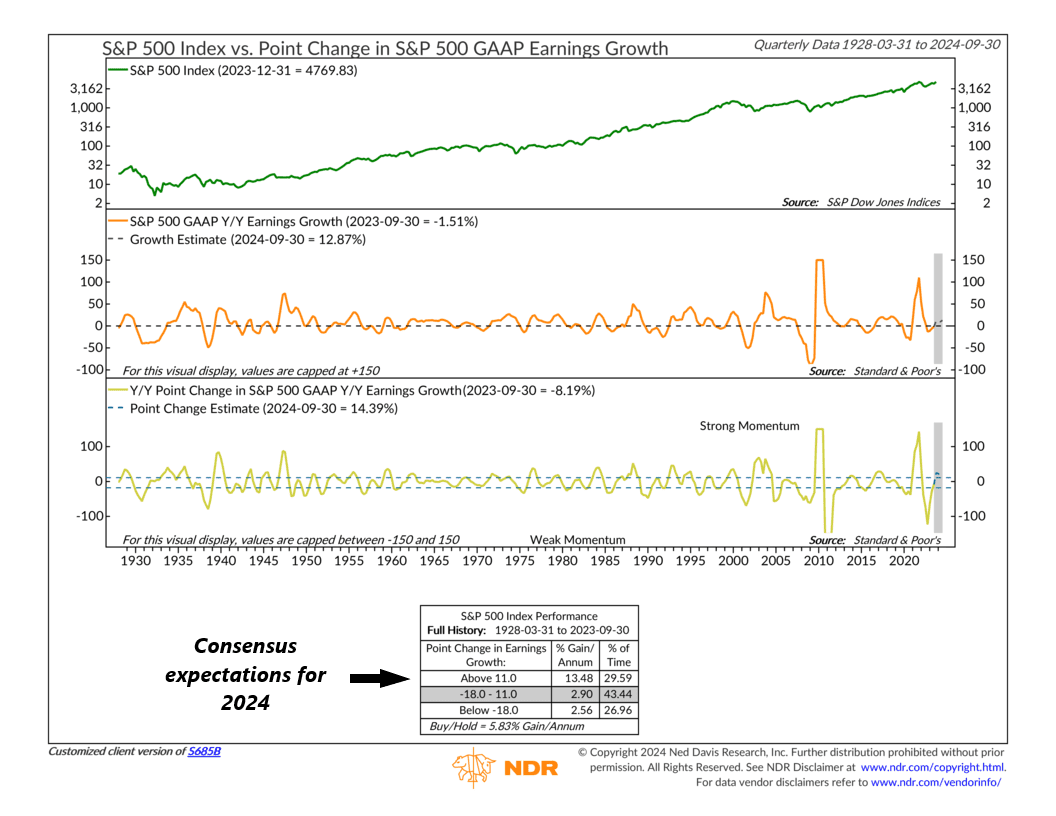
More importantly, though, the bottom clip shows that the change in the growth rate—its momentum—is increasing. As you can see, the consensus estimates call for accelerating EPS growth this year, putting this indicator in its most bullish zone for stock market returns.
With that said, however, some negatives are piling up on the other side of the investing scale.
For one, volatility indicators are starting to flash warning signs. The indicator below measures the 12-day/68-day trend in the VIX Index—a measure of investors’ expectations for stock market volatility. It recently rose to a level that has historically been negative for stock returns.
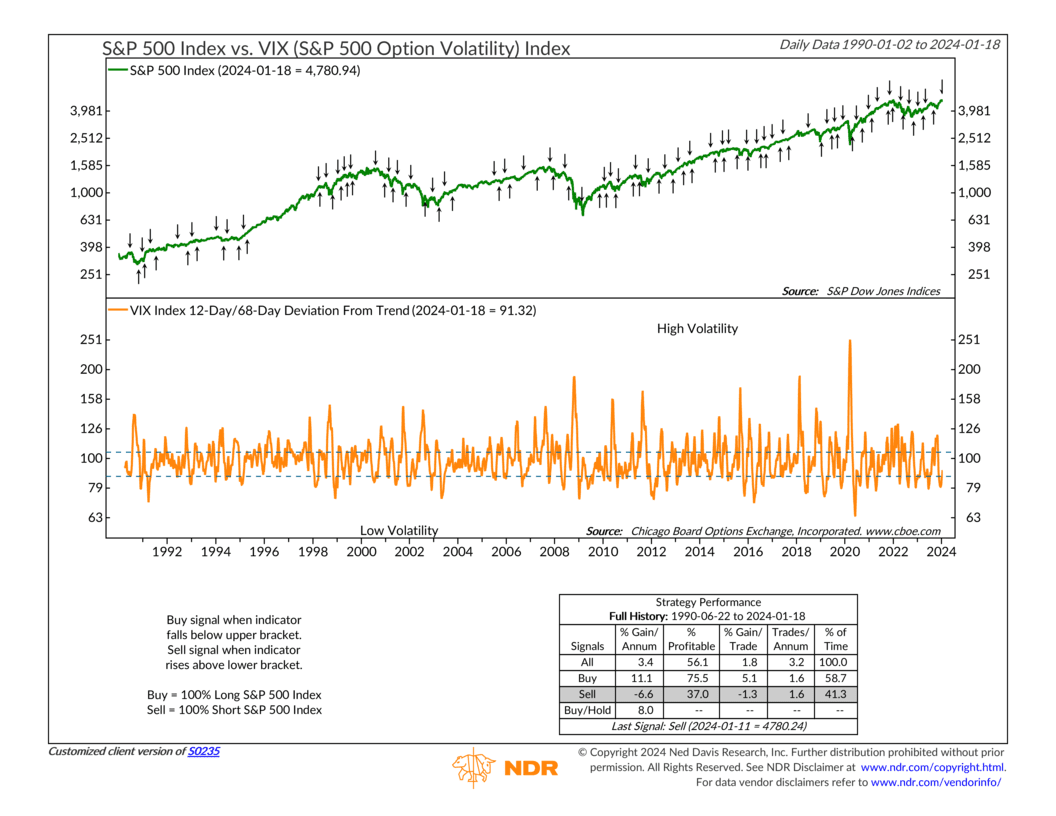
This is a dangerous place for the stock market, as it’s a sign that investors have become complacent—and complacency breeds instability.
This also happens to be occurring during what could seasonally be a weak period for the stock market. The chart below shows how the S&P 500 Index normally performs during a typical 4-year presidential cycle. For the most part, the index has tracked the first three years closely (trend is more important than level), and now we are entering the final (election) year.
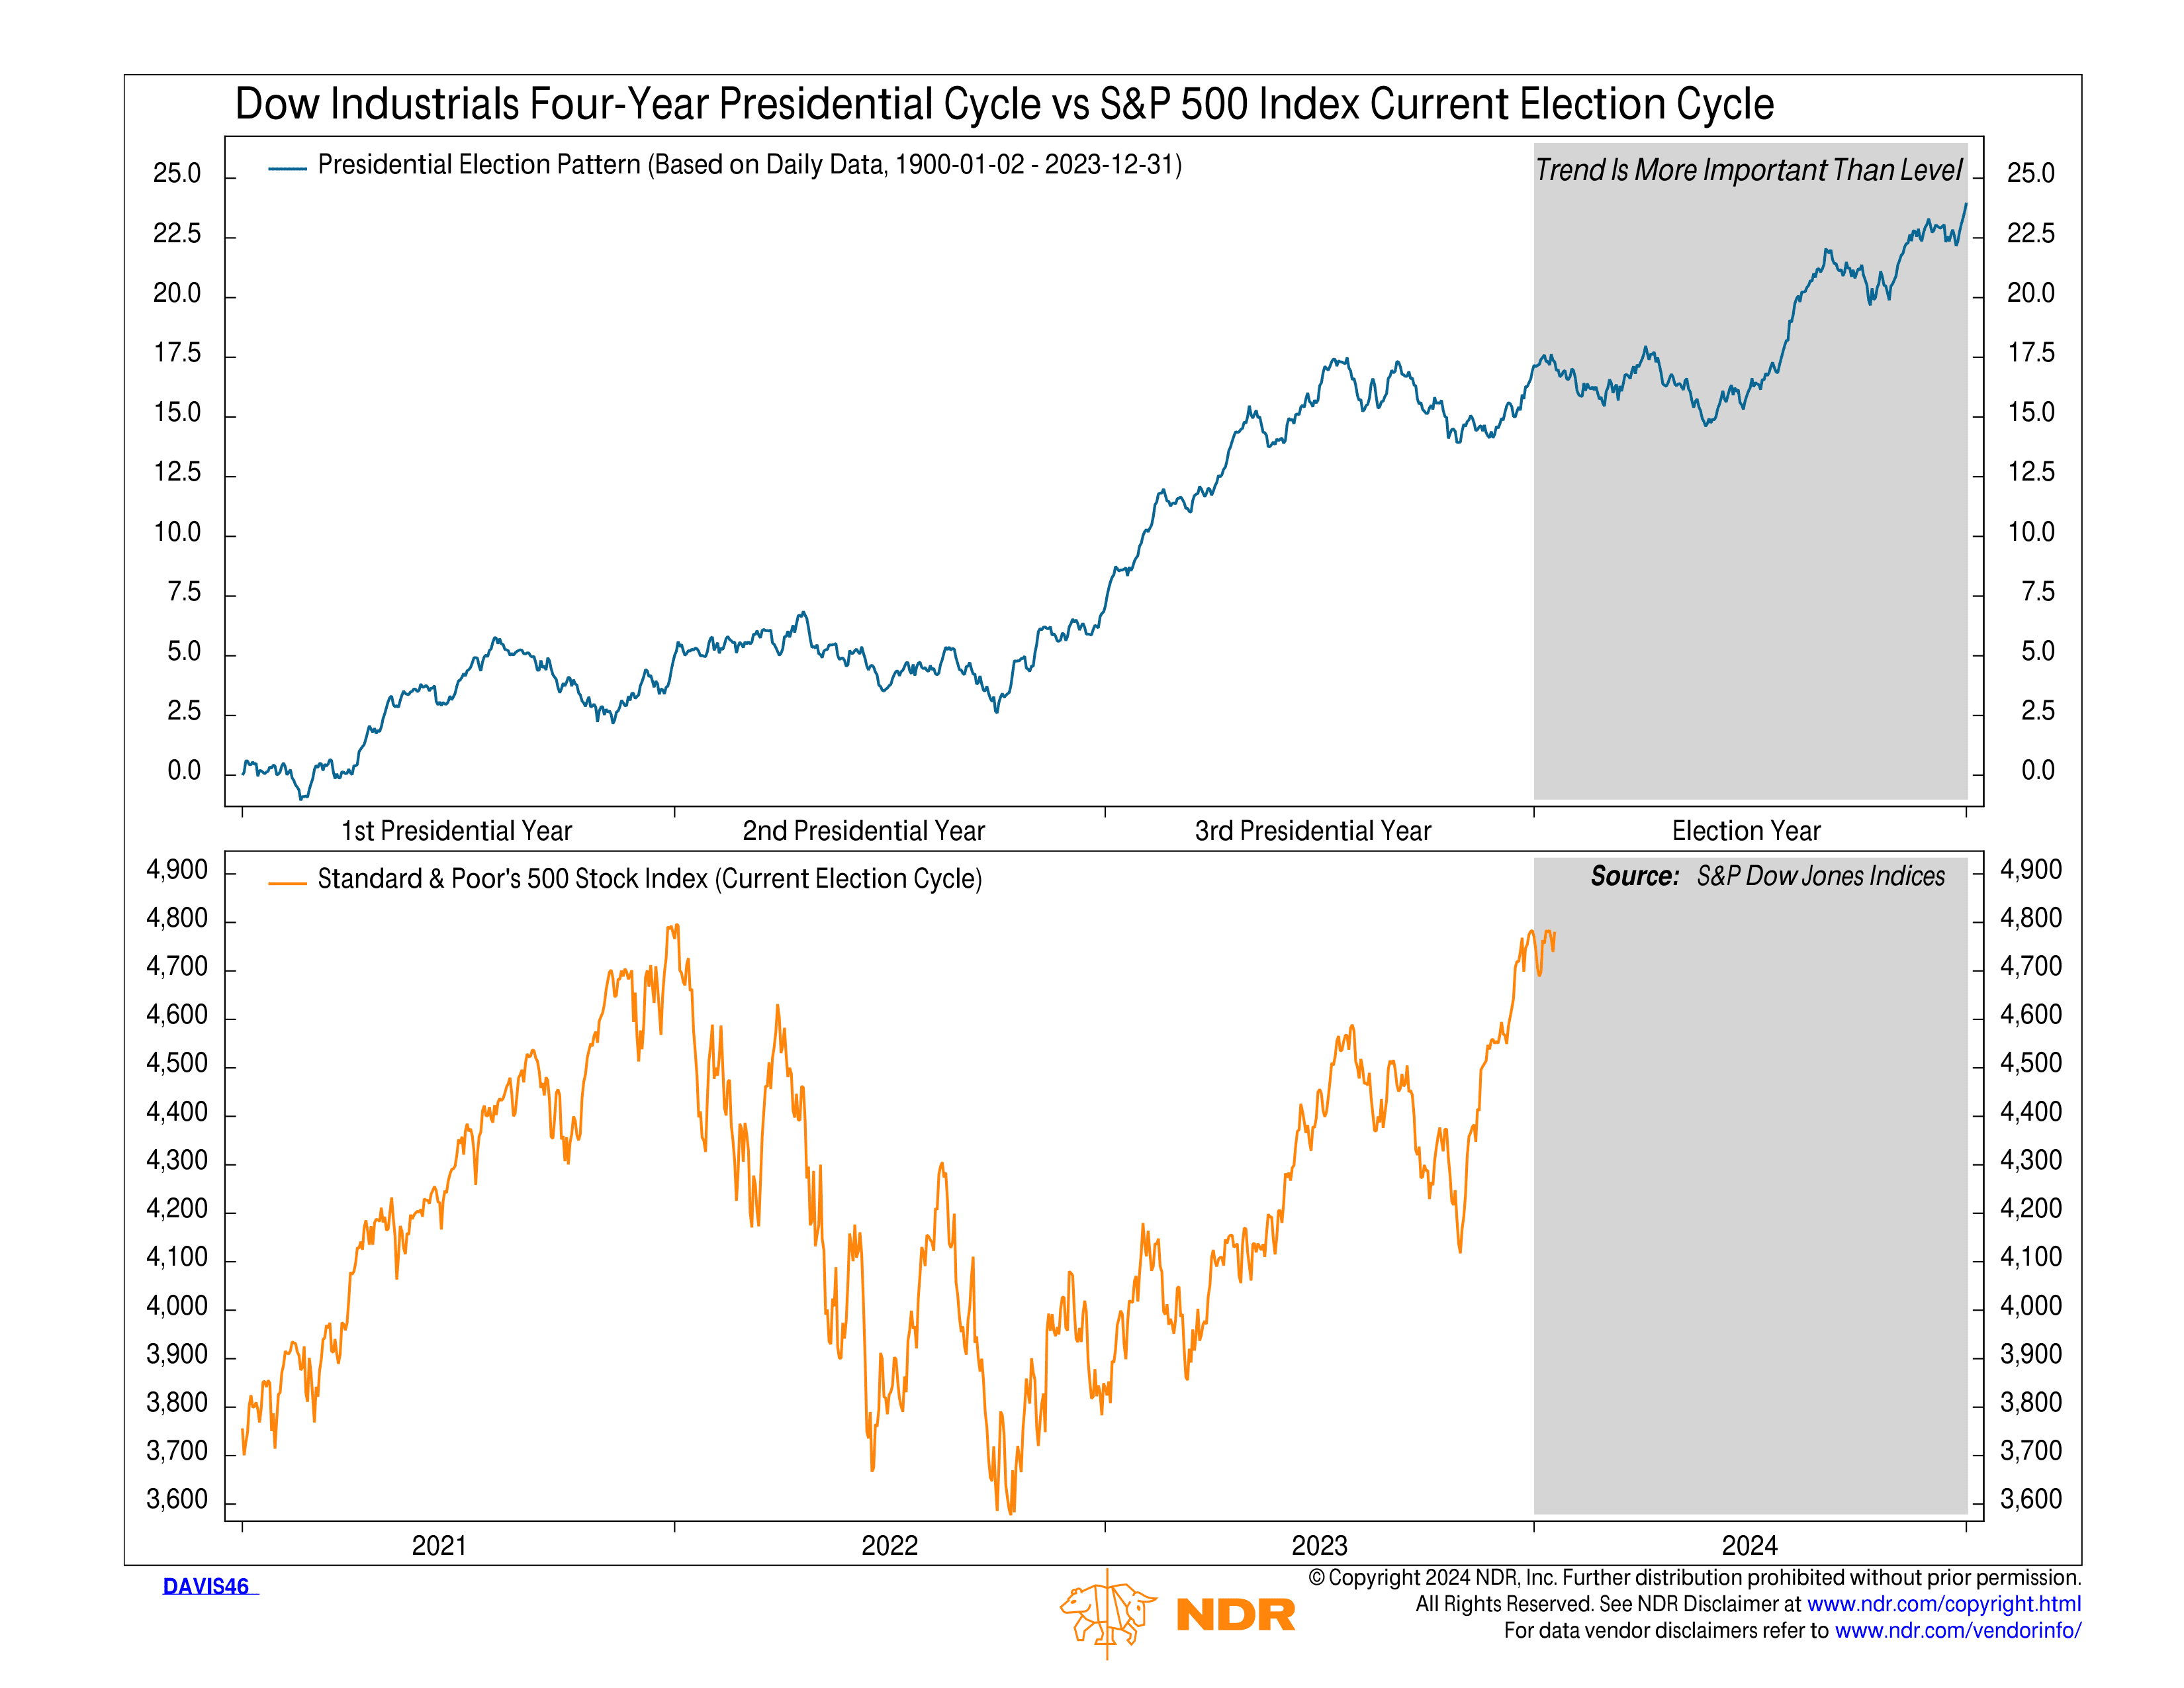
What should we expect? Well, according to the indicator, stocks tend to trade sideways to slightly down for the first few months before finally rallying to end the year once all the uncertainty regarding the election is washed away. Barring some other catalyst or market-moving event, we see no reason this year will turn out differently.
So, there we have it. We have a handful of indicators that are bullish on stocks and a handful of others that are more bearish, at least in the short term. What to make of this? Well, since we seek to follow the weight of the evidence, we lean in whichever direction is the heaviest.
And right now, that direction is more towards the positive side. Mostly, this is due to the strong market price movement indicators—which I haven’t mentioned yet but hold more weight than some of the other indicators.
This final chart does a great job of summarizing the overall message. It’s a price movement indicator that shows the average price of the S&P 500 over the past 126 days. We call it a 126-day moving average (orange line, bottom clip). It basically tells us how the market is trending over the intermediate/long term.
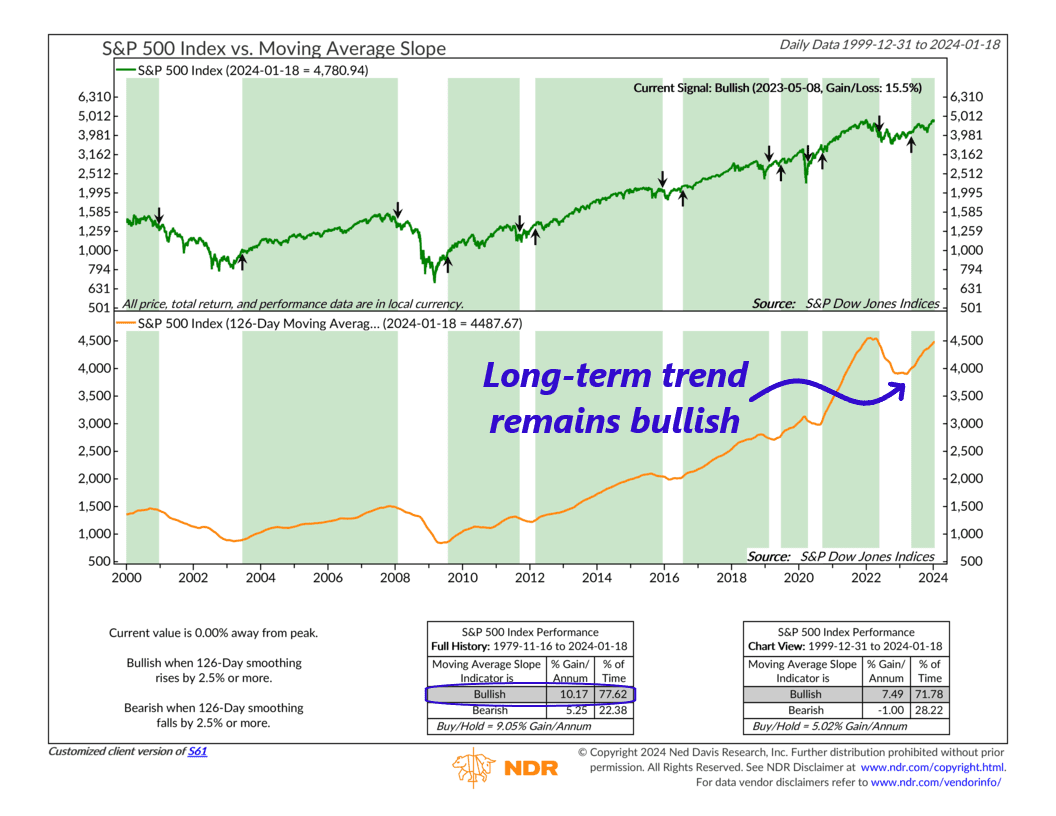
As you can see, it remains in the uptrend established last year. This makes sense, given the market just hit a record high last week.
The bottom line? This will continue to tilt the balance in favor of stocks over other asset classes until we see a material change in the trend.
This is intended for informational purposes only and should not be used as the primary basis for an investment decision. Consult an advisor for your personal situation.
Indices mentioned are unmanaged, do not incur fees, and cannot be invested into directly.
Past performance does not guarantee future results.
The S&P 500 Index, or Standard & Poor’s 500 Index, is a market-capitalization-weighted index of 500 leading publicly traded companies in the U.S.
The post Balancing Act first appeared on NelsonCorp.com.