OVERVIEW
Last week was a win for U.S. stocks as things calmed down a bit in the market. The VIX Index, a measure of market volatility, dropped by over 10%.
The S&P 500 went up by 0.55%, the Dow Jones Industrial Average gained 1.14%, and the Nasdaq Composite increased by 1.43%.
Among different types of stocks, growth stocks were the stars, with a 1.04% gain, while value stocks only nudged up by 0.14%. Small-cap stocks had the best performance, with a solid 1.36% increase.
Here’s what happened internationally. Developed countries’ markets saw a gain of 1.5%. Emerging markets did even better, with a 1.91% increase. The U.S. dollar lost some ground, slipping by 0.83% against other major currencies.
In the bond market, things looked good too. The yield on the 10-year Treasury note dropped to 4.52%, down from 4.67% the week before, which generally means good things for bonds. Overall, bonds increased by 0.9% for the week.
Real estate investments had a strong showing, climbing by 1.42%. However, commodities didn’t fare as well. Oil prices dropped by 6.54%, gold prices fell by 1.64%, and corn prices bucked the trend, rising by 2.28%.
KEY CONSIDERATIONS
Seeking Higher Ground – The U.S. stock market is coming off an all-time heater.
What do I mean by that?
Well, if we look at the S&P 500 Index, a popular proxy for the “stock market,” we see that it rose over 25% in just five months.
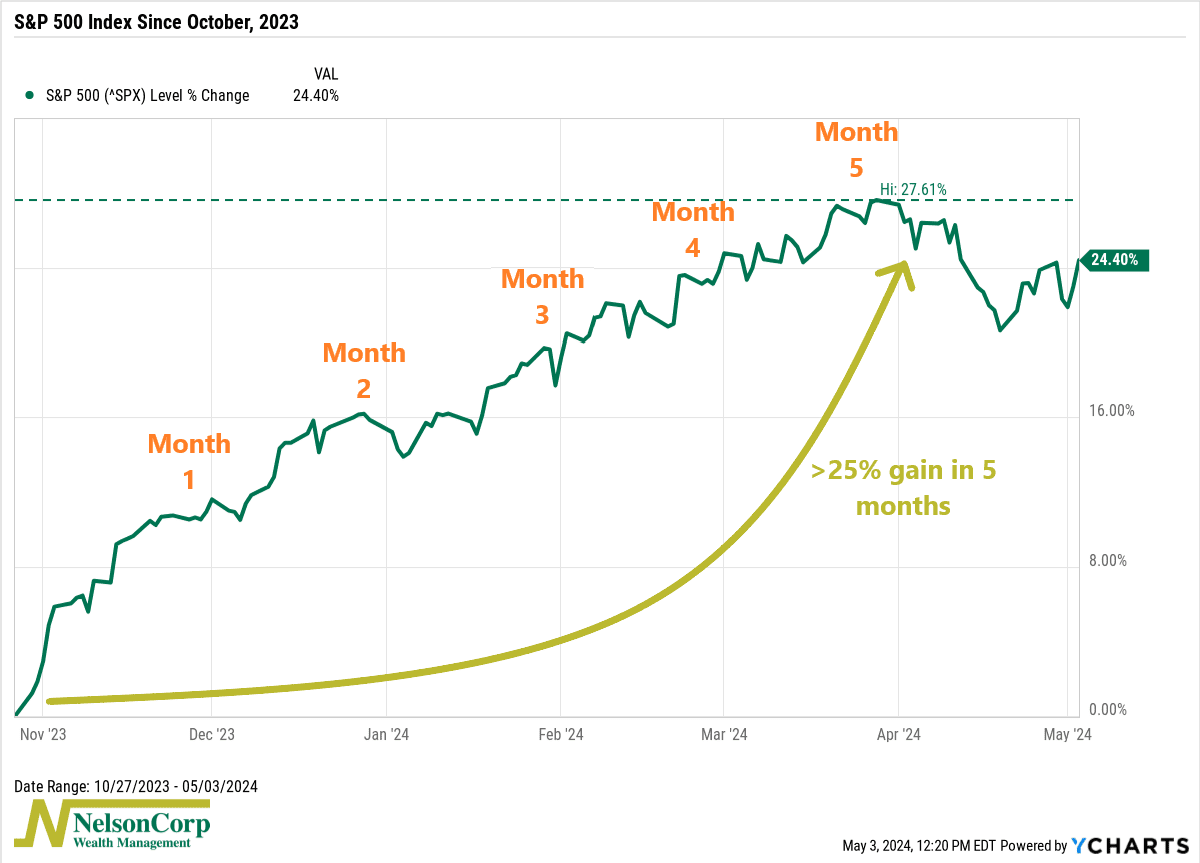
Not bad. That’s only happened six other times since World War II.
So naturally, that got me thinking: How did the market perform after these previous occurrences?
The answer, according to the table below, is pretty good!
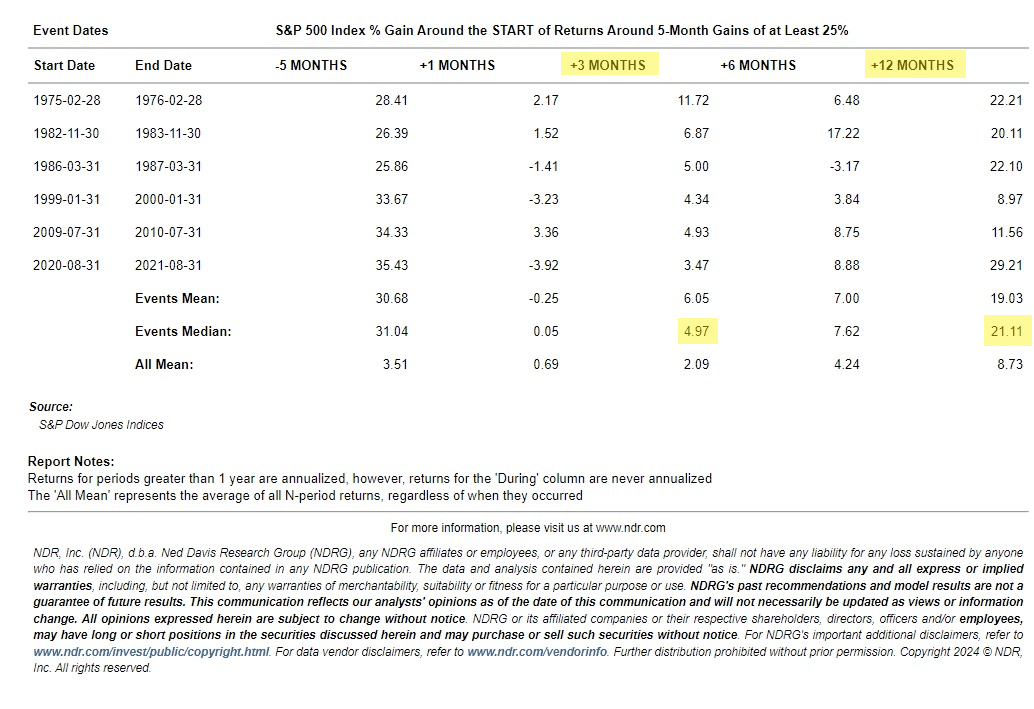
The median (or average) S&P 500 gain three months later was about 5%, with a positive gain occurring in every instance. Extend that to a year later and the average gain jumps to about 21%.
Here’s what that looks like visually, with the dark blue line representing the mean performance:
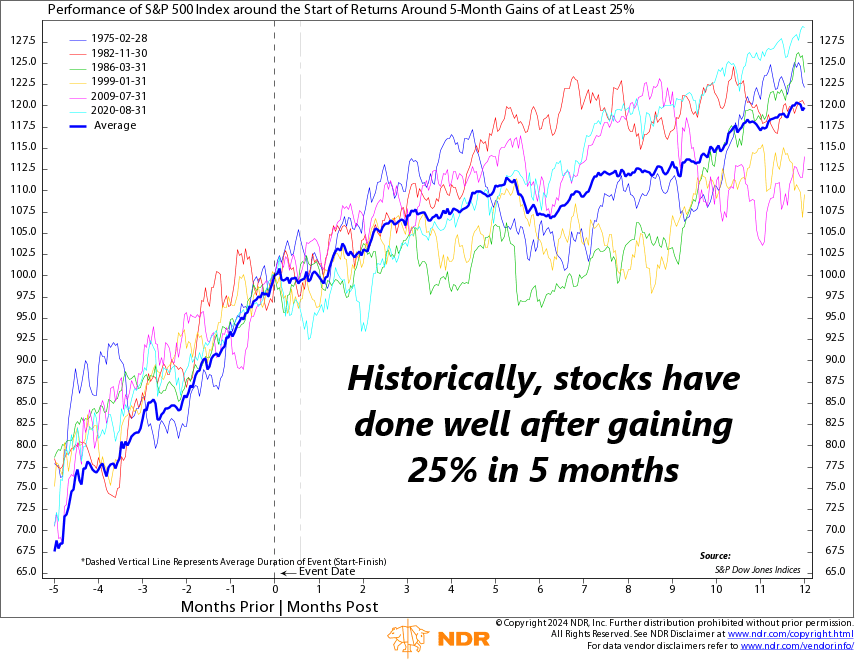
In other words, strong momentum surges like the one we just witnessed don’t usually occur near the end of bull markets. They tend to happen after big bear markets or in the middle of bull markets.
Now, we did see a bit of a setback last month when the S&P 500 dropped by over 5% from its peak. However, it has since recovered about half of that loss over the past few weeks.
So, how are vibes?
Well, according to the chart below, the vibes are good.
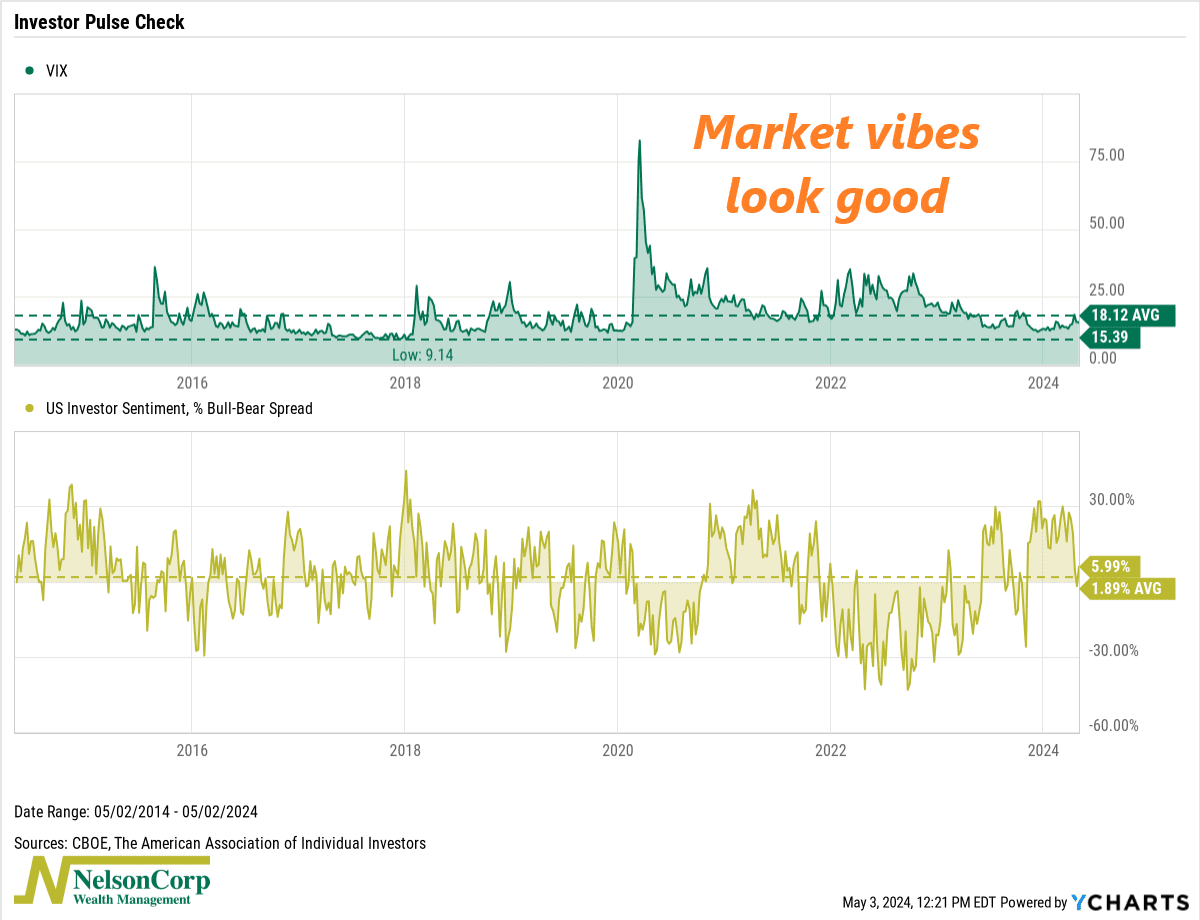
The VIX Index (top clip), which measures stock market volatility (often dubbed the “fear gauge”), is currently below its 10-year average, indicating lower levels of anxiety among investors.
Additionally, the Investor Sentiment gauge (bottom clip) shows an equal number of bullish and bearish investors, suggesting a fairly neutral stance.
Therefore, according to this “investor pulse” chart, things look pretty good right now.
Putting it all together, the overall message is that the market probably has plenty of gas left in its tank.
This is intended for informational purposes only and should not be used as the primary basis for an investment decision. Consult an advisor for your personal situation.
Indices mentioned are unmanaged, do not incur fees, and cannot be invested into directly.
Past performance does not guarantee future results.
The S&P 500 Index, or Standard & Poor’s 500 Index, is a market-capitalization-weighted index of 500 leading publicly traded companies in the U.S.
The post All-Time Heater first appeared on NelsonCorp.com.