OVERVIEW
The U.S. stock market continued to sell off last week, with the S&P 500 falling 3.29%, the Dow Jones Industrial Average dropping 2.99%, and the Nasdaq Composite plunging 4.21%.
Foreign stocks slipped up as well. Developed country stocks fell 3.13%, and emerging markets dropped 3.43%.
The 10-year Treasury climbed to 3.2%, up from 3% the previous week. Intermediate-term Treasuries traded down 0.73%, and long-term Treasuries fell 2.55%. Investment-grade corporates and high-yield bonds both fell over 1.5% for the week.
Commodities didn’t fare any better. The Bloomberg Commodity Index dropped 4.41%, driven lower by the 5.83% decline in oil prices and the 1.55% drop in gold prices. The U.S. dollar strengthened 0.86%.
KEY CONSIDERATIONS
A Rude Awakening – August was a tough month for financial assets. The chart below shows the monthly returns for the following asset classes: stocks, treasuries, investment-grade and high-yield corporate bonds, and commodities.
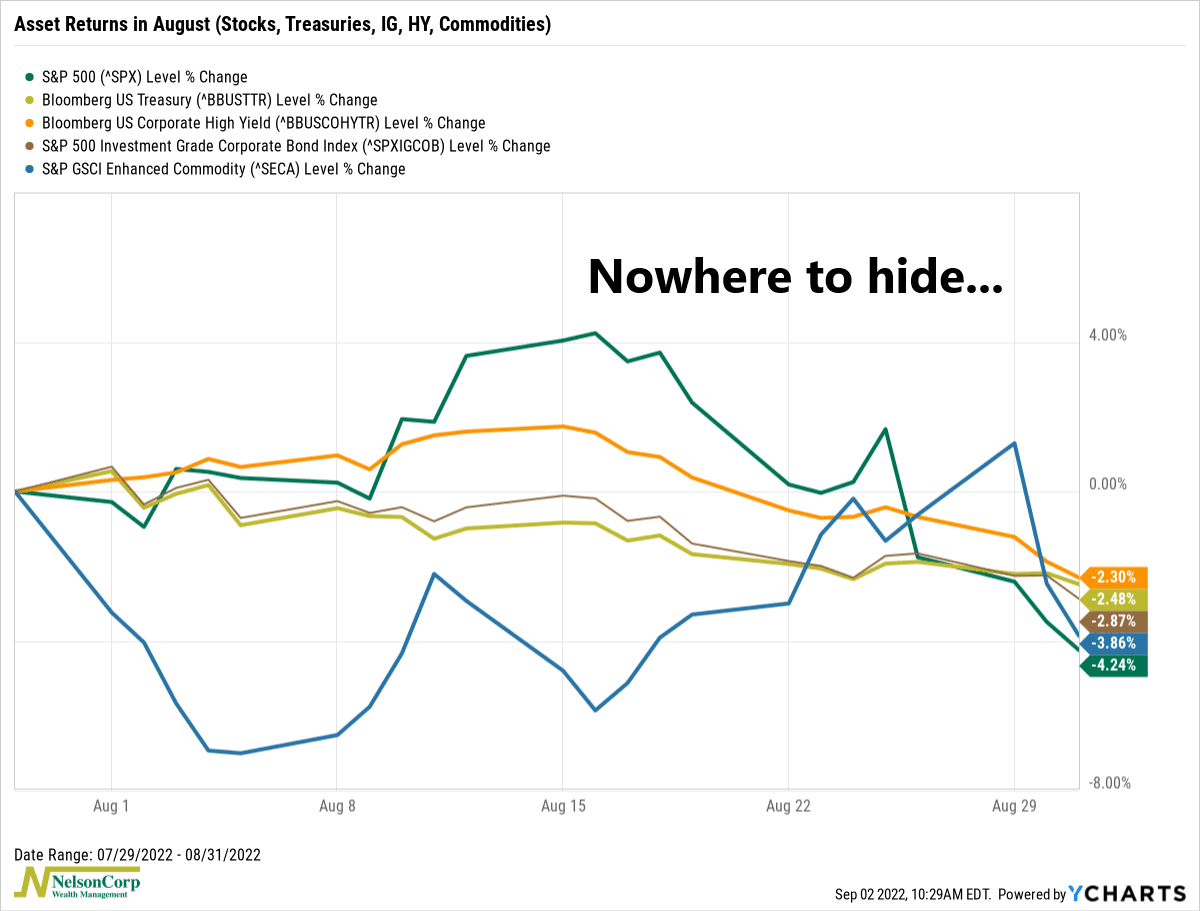
According to Bloomberg, the last time the best-performing asset out of these five had a worse month was December 1981.
What happened? Well, as we discussed last week, Fed Chair Jerome Powell jolted the markets with his tough talk on inflation, and now things are looking more volatile.
The best way to visualize this is to look at the CBOE Volatility Index or the VIX. Also known as the stock market’s “Fear Gauge,” the VIX measures the market’s expectations for volatility over the coming 30 days.
It went dormant for a few months as the stock market rallied. But now stocks are pulling back, and volatility has moved higher, triggering a sell signal on our short-term VIX indicator, shown below.
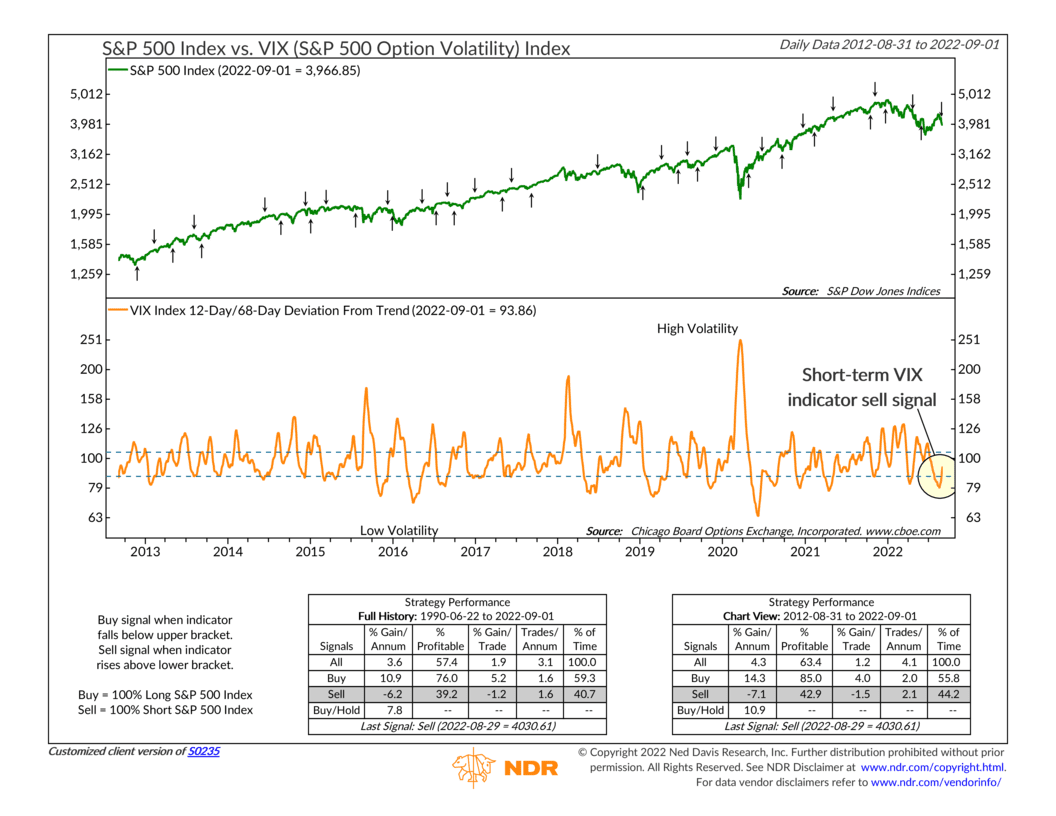
This is what we call a deviation-from-trend indicator. It takes a short-term moving average and divides it by a long-term moving average. In this case, we divide the 12-day moving average of the VIX by its 68-day moving average. When this measure falls below the lower bracket and reverses, it signifies that volatility is picking up from a low point. Historically, this has led to lower-than-average returns for the S&P 500 stock index.
So, volatility is back. And so is the notion that good news is bad news for the stock market because better economic data means the Fed can maintain aggressive monetary policy tightening.
Take the up-is-down world of the labor market, for example.
Last week, we found out that the total number of job openings in the U.S. unexpectedly rose to 11.24 million, compared to just 5.67 million Americans currently unemployed. That equates to a ratio of nearly two open jobs for every unemployed person.
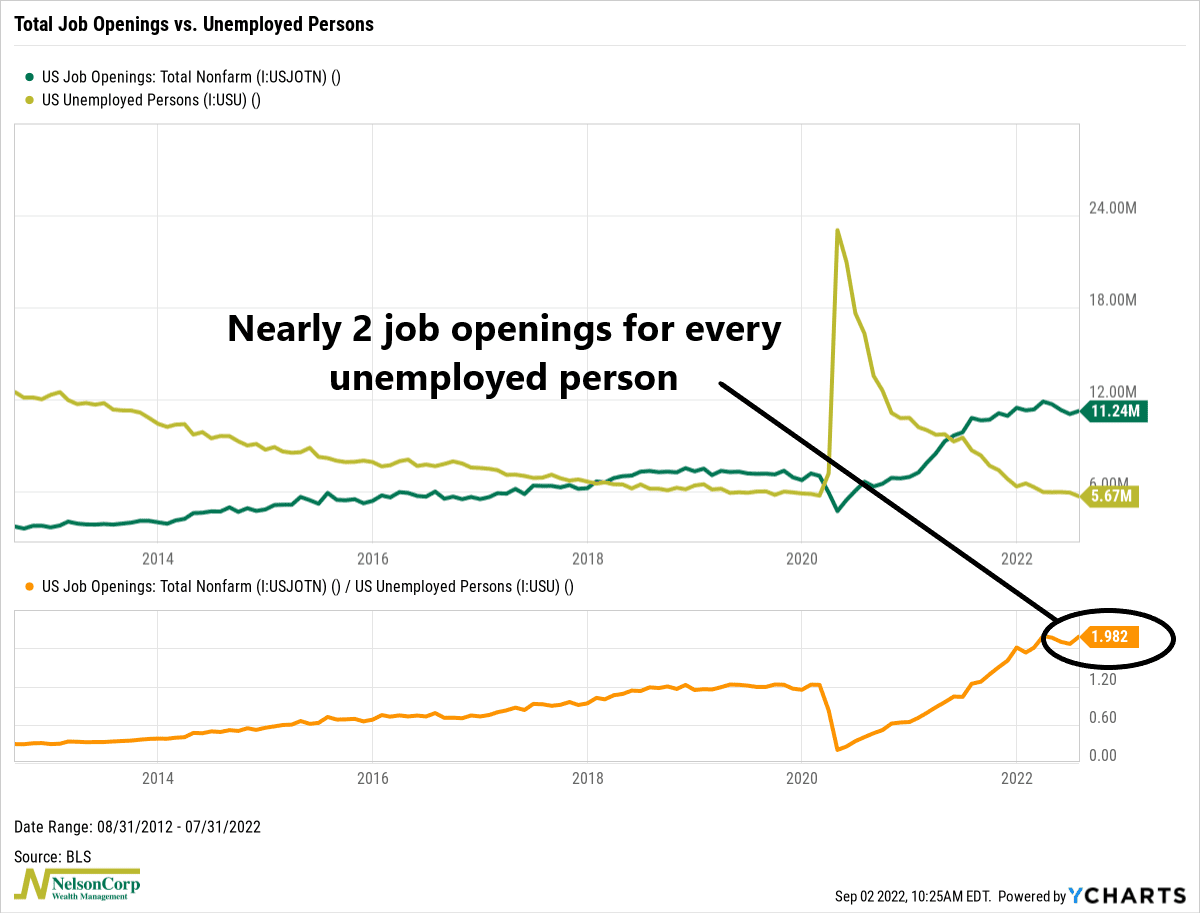
Based on that data point alone, it would appear that the labor market remains too hot to handle, which, in theory, should continue to pressure wages and inflation and encourage the Fed to tighten the screws more.
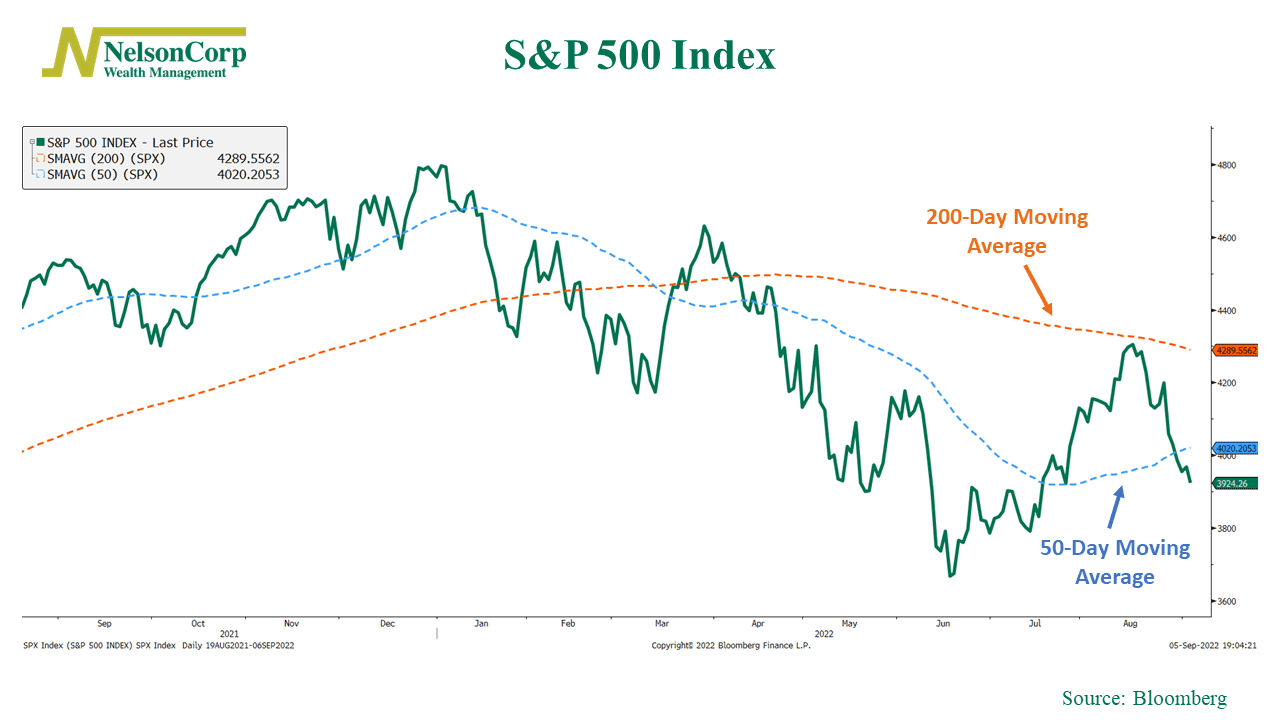
As for how the stock market is reacting to everything going on right now, the technicals look pretty ugly.
Not only did the S&P 500 fail to breach its 200-day average price (orange dashed line) two weeks ago, but it also fell below its 50-day average price last week (blue dashed line). All the price momentum built up over the past few months has been washed away in a matter of a few weeks.
So, the bottom line is that a tight labor market and a hawkish Fed combined with a rising VIX and poor technical action continues to leave this market vulnerable to more volatility and price selloffs.
This is intended for informational purposes only and should not be used as the primary basis for an investment decision. Consult an advisor for your personal situation.
Indices mentioned are unmanaged, do not incur fees, and cannot be invested into directly.
Past performance does not guarantee future results.
The post A Rude Awakening first appeared on NelsonCorp.com.