OVERVIEW
Financial markets saw mostly mixed performances during the shortened holiday week last week. The S&P 500 fell 0.1%, and the Nasdaq dropped 1.1%, whereas the Dow gained 0.63%.
The rally was led by large-cap stocks, which rose by approximately 0.41%. However, small-cap stocks fell behind, losing about 2.7% for the week.
Foreign stock markets had mixed performances, with developed country stocks gaining 0.4% and emerging markets losing about 0.32%.
Bond yields fell, which caused bond prices to rally. Intermediate-term Treasuries increased by 1.15%, and long-term Treasuries rose by 2.37%. Investment-grade corporate bonds rose by 0.45%, and high-yield (junk) bonds climbed by 0.09%.
Real estate experienced a down week, dropping about 0.78%, whereas commodities overall saw an increase of about 0.69%. Oil emerged as the big winner, with a rise of 5.75%, while gold also increased by 2.02%. These gains were assisted by a 0.5% weakening in the U.S. dollar.
KEY CONSIDERATIONS
A Peek Under the Hood – This week, I would like to offer a glimpse into our primary stock market risk model and share some insights on recent developments.
When assessing stock market risk, we consider approximately 108 different indicators, each of which can be positive, neutral, or negative at any given moment. The collective output of these indicators determines our overall model.
In particular, I want to discuss the ratio of positive to negative indicators. We can graph this ratio over time and examine how it has evolved. Here’s what that looks like.
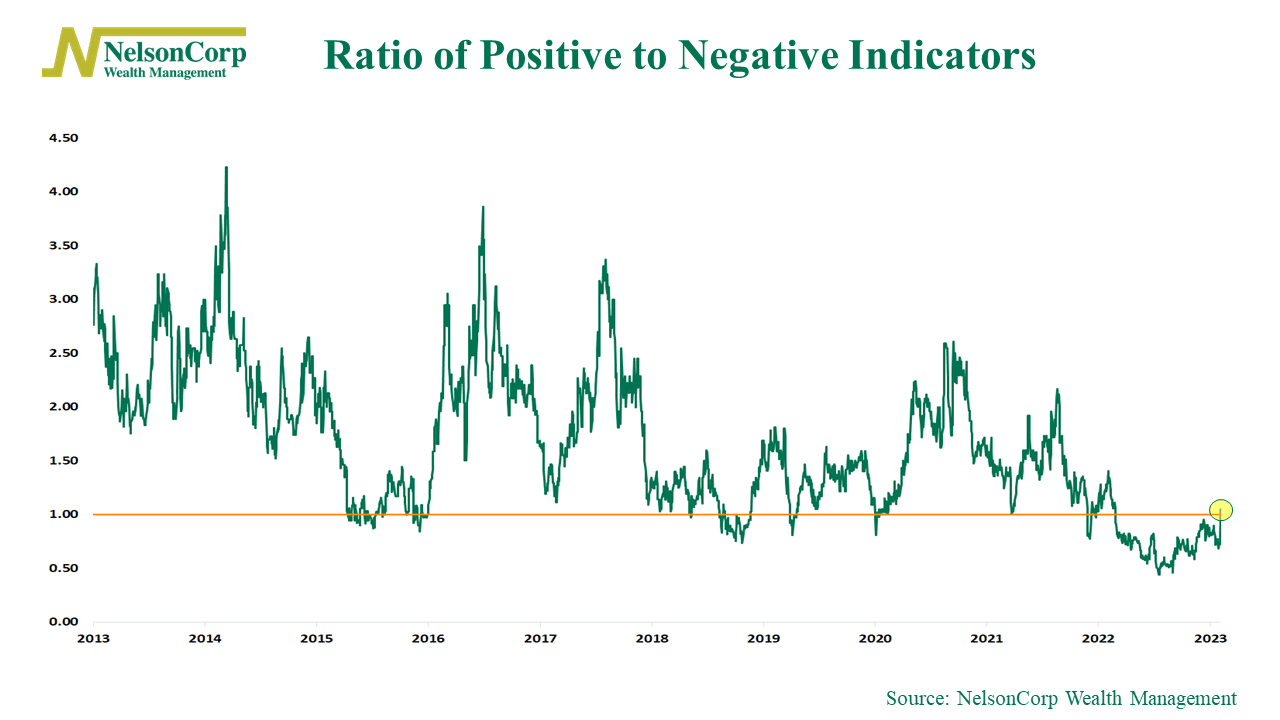
A ratio of one—the orange line on the chart—means the model has equal numbers of positive and negative indicators. Typically, the ratio is greater than one as the stock market tends to rise over time. However, during major downturns in stock prices, the ratio turns negative.
Last year was one such time. The ratio dropped below 0.5, indicating more than double the number of negative to positive indicators.
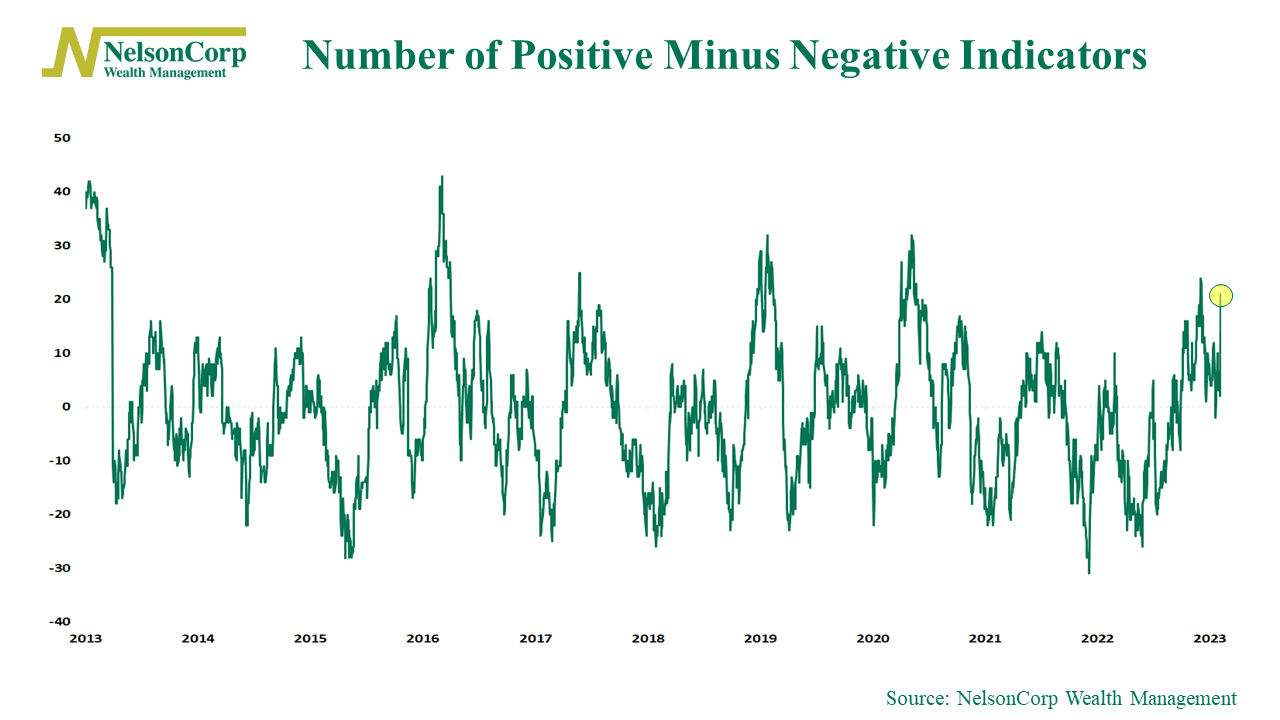
Fortunately, though, the ratio has significantly improved in recent months. Over the past three months, the number of positive indicators has increased by 8, and the number of negative indicators has decreased by 13, resulting in a net positive change of 21.
While this improvement is encouraging, there is still much room for further enhancement in the model. The current ratio of positive to negative indicators at 1.05 is relatively low compared to the historical average of 1.67, so it’s advisable to exercise caution.
Nevertheless, investors may take comfort in the recent improvements if they are considering investing more money.
This is intended for informational purposes only and should not be used as the primary basis for an investment decision. Consult an advisor for your personal situation.
Indices mentioned are unmanaged, do not incur fees, and cannot be invested into directly.
Past performance does not guarantee future results.
The post A Peek Under the Hood first appeared on NelsonCorp.com.