OVERVIEW
U.S. stocks pushed higher last week as the tech-heavy Nasdaq Composite reached an all-time high on the back of a 1.7% weekly gain. The S&P 500 rose further into record-high territory, climbing 0.95% for the week. The Dow, however, fell about 0.11%. And small caps outperformed everything, with the Russell 2000 surging 2.8%.
Overseas, foreign stock markets had mixed results. Developed country stocks saw a 0.7% rise, while emerging markets experienced a slight decline of 0.35%. The U.S. dollar held steady against major world currencies.
In the bond market, there were decent gains across the board. The 10-year Treasury rate dropped to 4.19%, leading to moderate gains for longer-dated Treasuries and an overall 0.2% increase for the bond market.
Commodities also had a good week, with a 1.9% overall increase. Oil prices led the way with a 4.2% gain, while gold rose by 2.26% and corn saw a 2.7% increase.
KEY CONSIDERATIONS
A Hair’s Breadth Away – The big news last week was the tech-heavy Nasdaq Composite hitting its first new high since November 2021. That’s quite a milestone, considering it took 569 trading days to get there!
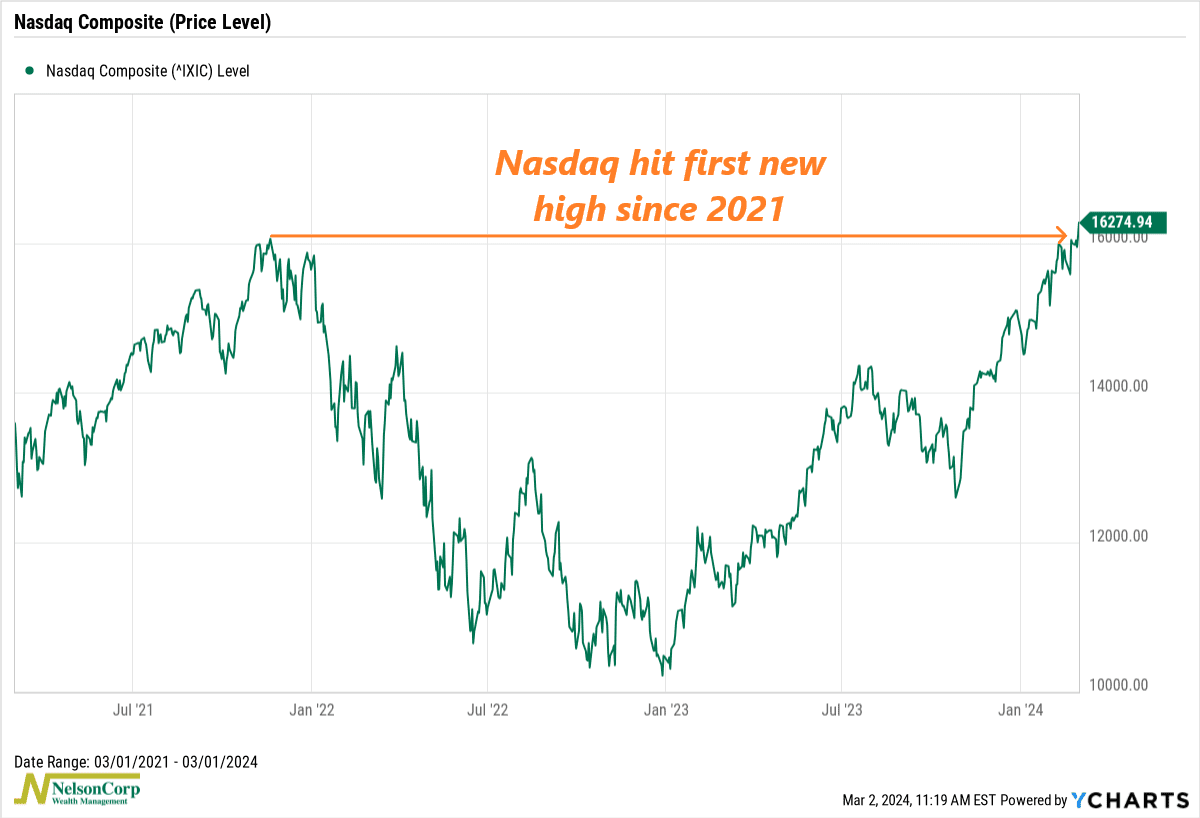
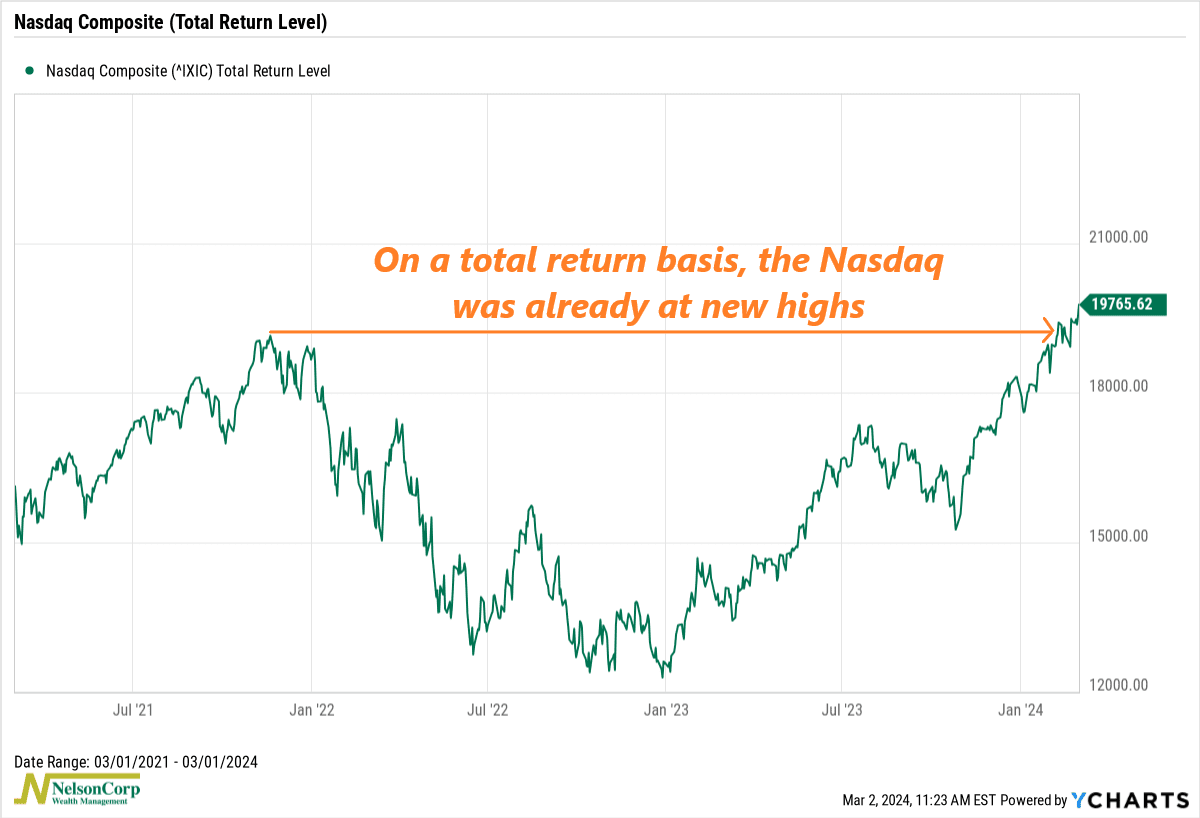
Now, to be fair, if we add in dividends to get the total return for the index (shown below), we see that the Nasdaq already hit a record high about a month ago. But still, last week’s new high was a good thing to see for the overall health of the bull market.
As for the S&P 500 Index—the index we typically cite when talking about the “stock market”—it continued to push into new high territory last week.
We’ve talked about how strong the recent gains have been for the S&P 500, so I won’t belabor the point. But there is one thing I’d like to highlight: inflation-adjusted returns.
Inflation was the obvious culprit that sent stock prices lower in 2022, so it makes sense for us to look at how stocks have performed after accounting for the loss in purchasing power created by rising prices.
As this next chart shows, stocks are still underwater when compared to the inflation-adjusted record high set at the end of 2021.
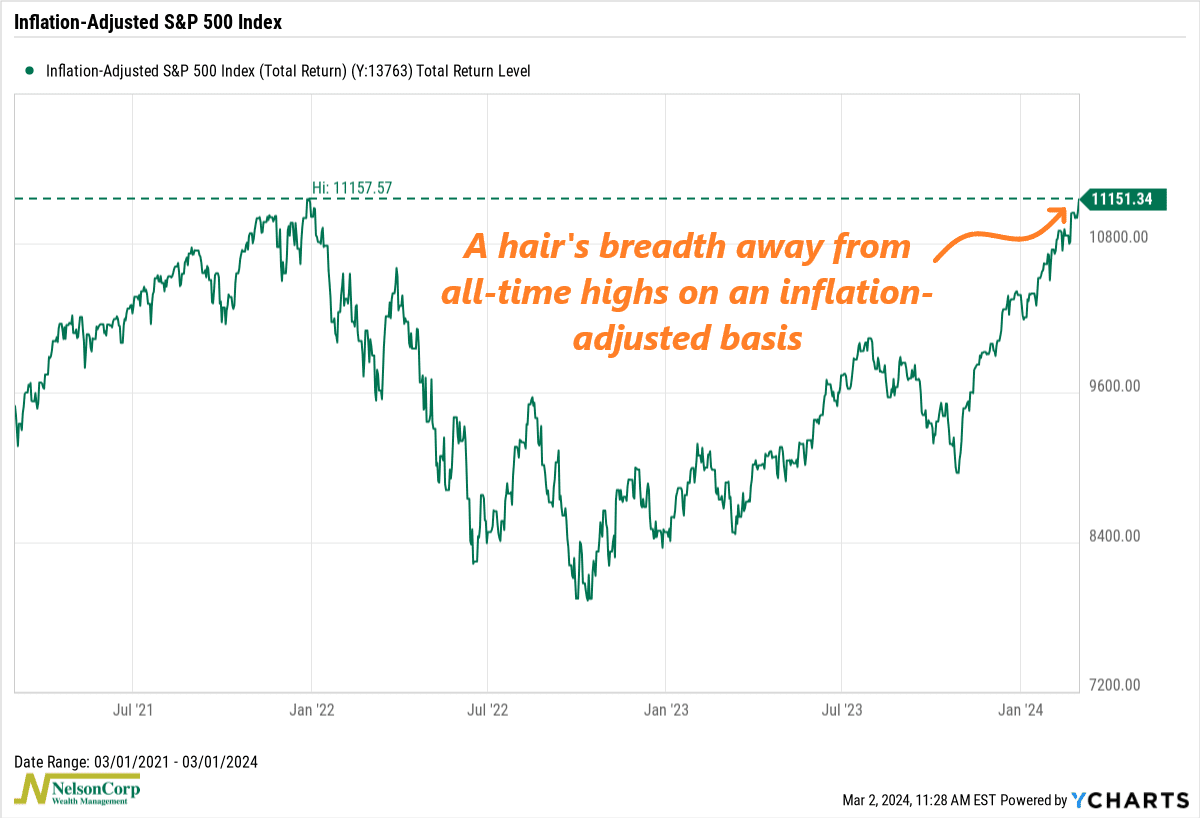
But, as you can see on the chart, the index is just a hair’s breadth away from surpassing that record-high level. After last week’s rally, we are essentially there. It’s a foregone conclusion at this point.
Under the surface, if we continue to see more individual stocks hitting new highs, it should help the market reach new highs on an inflation-adjusted basis. The chart below illustrates that the percentage of NYSE stocks hitting new 52-week highs is on the rise, which is generally a positive sign.
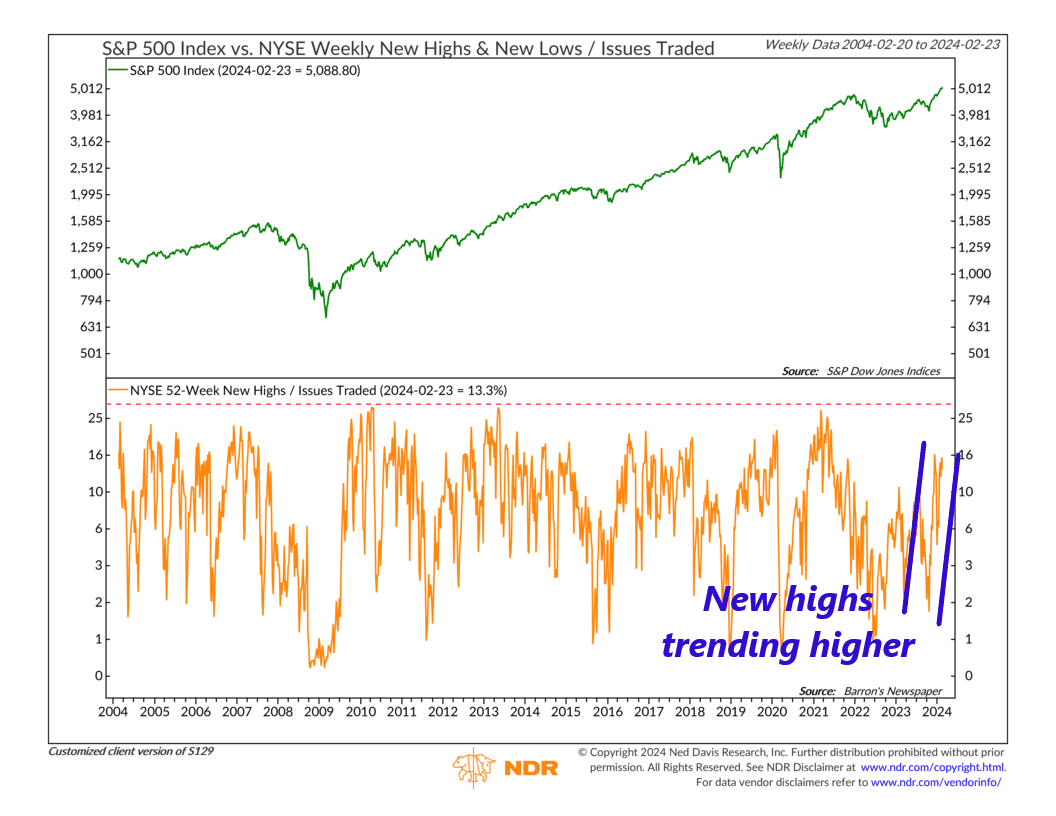
The bottom line? The evidence suggests that the market environment remains favorable for risk assets like stocks. While there’s still progress to be made, the broadening breadth of the market is encouraging news for investors.
This is intended for informational purposes only and should not be used as the primary basis for an investment decision. Consult an advisor for your personal situation.
Indices mentioned are unmanaged, do not incur fees, and cannot be invested into directly.
Past performance does not guarantee future results.
The S&P 500 Index, or Standard & Poor’s 500 Index, is a market-capitalization-weighted index of 500 leading publicly traded companies in the U.S.
The NYSE Composite Index is a float-adjusted market-capitalization weighted index which includes all common stocks listed on the NYSE, including ADRs, REITs and tracking stocks and listings of foreign companies.
The NASDAQ Composite Index is a broad-based capitalization-weighted index of stocks in all three NASDAQ tiers: Global Select, Global Market and Capital Market.
The post A Hair’s Breadth Away first appeared on NelsonCorp.com.