OVERVIEW
The U.S. stock market fell last week, its second consecutive week of declines for the first time in five months. The S&P 500 dropped 0.13%, the Dow dipped 0.02%, and the Nasdaq declined 0.7%. Lagging the large-cap indices were small-cap stocks, which fell more than 2% for the week.
Foreign stocks didn’t fare any better. Developed country stocks fell 1.4%, and emerging markets dropped 0.23%.
Bond prices suffered declines as well as the benchmark 10-year Treasury rate rose to 4.32%, up from 4.08% the week before. Overall, bond prices fell about 1.2%.
Commodities, on the other hand, had a better week. Overall, they rose about 1.2%, led by oil, which gained 4%. Gold, however, fell about 0.5%. Real estate had a tough week, down 2.9%. And the U.S. dollar increased about 0.7%.
KEY CONSIDERATIONS
A Breadth of Fresh Air – Imagine you’re invited to a party at a friend’s place, and when you arrive, you find a table filled with all sorts of snacks – fruits, cookies, chips, dip, you name it. It’s great! Even if you’re not a fan of one particular snack, no worries! There are plenty of other delicious options to choose from. The variety keeps the party going.
That’s what having “breadth” in the stock market is like. When there’s a wide range of different stocks joining in on a market rally, it’s like having a diverse snack table – it makes the market stronger and more resilient. The market isn’t relying on just one or two stocks to keep things exciting.
One way we like to measure market breadth is by looking at the percentage of stocks in the S&P 500 Index that are trading above their average 200-day price, shown below. The higher the percentage, the better the breadth.
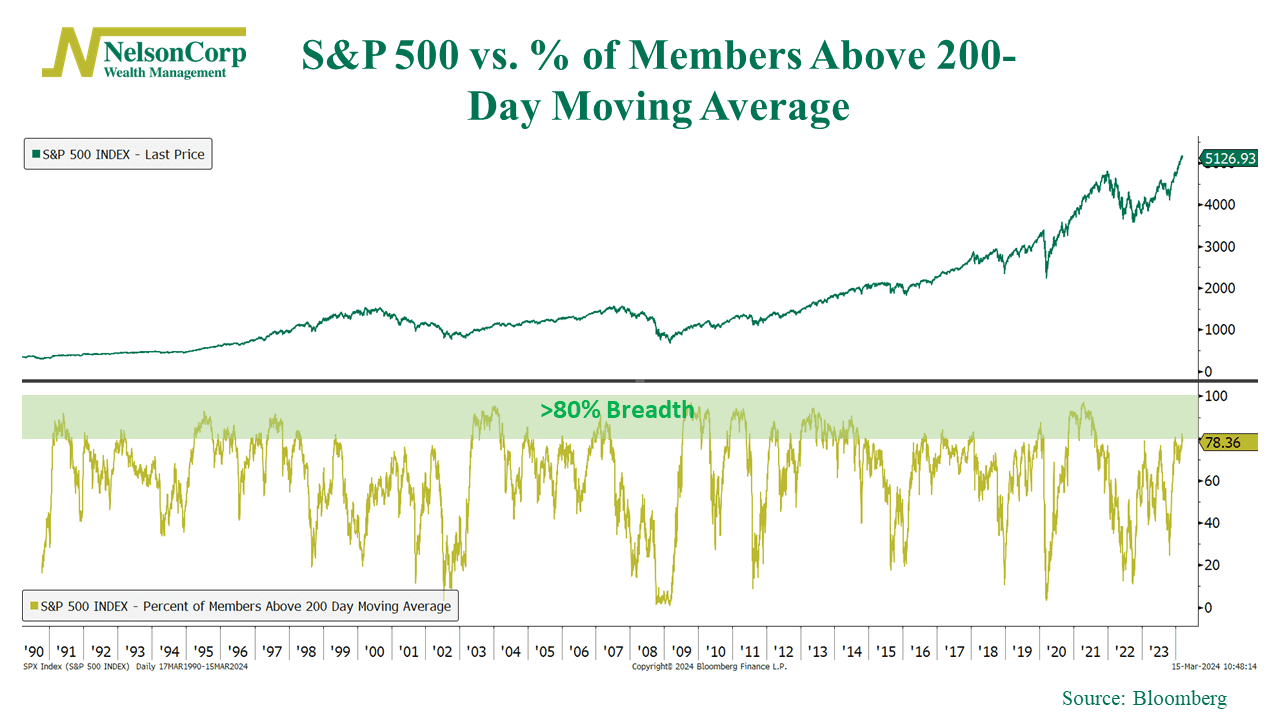
As you can see on the far-right-hand side at the bottom of the chart, it’s been climbing and is about to enter the green-shaded zone where more than 80% of S&P 500 stocks are in long-term uptrends.
We think this could be a positive driver of stock returns going forward. Historically, once breadth gets this high, it tends to stick around for several months as the market surges higher. The fact that we are just now entering this zone of “expansive breadth” means there is still more room for participation to increase among individual stocks in the coming months.
But, of course, that assumes financial markets stay as calm as they have in recent months. Even a great party can turn sour if something unexpectedly bad happens.
This next chart shows that measures of implied volatility (derived from the VIX Index) relative to historical volatility have been low and steady for quite some time. In other words, what investors think market volatility will be is lower than what actual volatility has been.
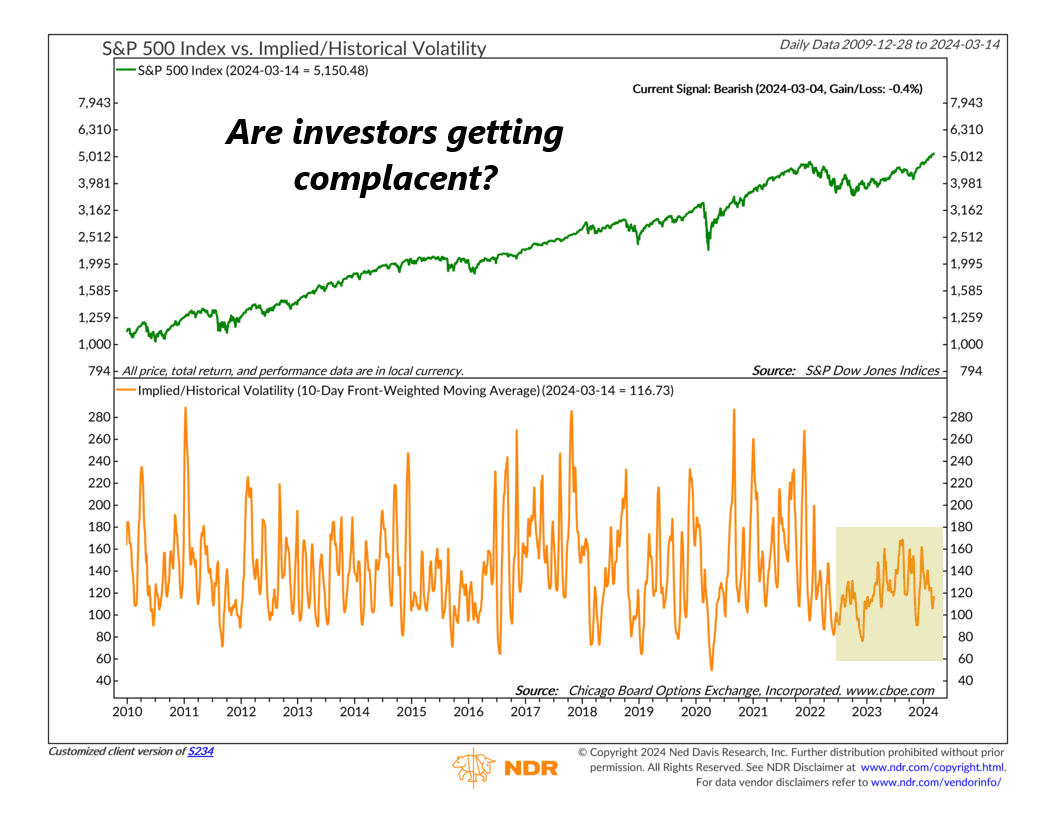
We usually see this type of reading when the market is rising, so that’s good. However, long stretches like this without a spike in implied volatility tend to be a sign of investor complacency—and when investors get complacent, any ole’ piece of unexpected bad news can send them running for the hills, selling their stock as they go.
So that’s a risk to keep an eye out for. The bottom line, though, is that the recent expansion in the stock market’s breadth is likely a breath of fresh air for investors—and this could help keep the market in positive territory for the year.
This is intended for informational purposes only and should not be used as the primary basis for an investment decision. Consult an advisor for your personal situation.
Indices mentioned are unmanaged, do not incur fees, and cannot be invested into directly.
Past performance does not guarantee future results.
The S&P 500 Index, or Standard & Poor’s 500 Index, is a market-capitalization-weighted index of 500 leading publicly traded companies in the U.S.
The post A Breadth of Fresh Air first appeared on NelsonCorp.com.