OVERVIEW
U.S. stocks rallied for the second week in a row, as the S&P 500 rose 1.55%, the Dow increased 1.05%, and the Nasdaq gained 2.38%.
Growth stocks did the best, rising 1.89% for the week, but value shares weren’t far behind, gaining 1.57%. Large-caps rose about 1.4%, and small-caps gained 0.92%.
Foreign stock markets did well overall. Developed country stocks gained 2.1%, and emerging markets rose 2.52%.
Bonds, however, had a rough week. The 10-year U.S. Treasury yield rose to 1.91%, resulting in intermediate-term Treasury losses of 1.03% and long-term Treasury losses of 2.83%. Investment-grade bonds fell 1.2%, and high-yield bonds declined 0.3%.
On the other hand, real assets had a good week. Real estate ticked up about 0.07%, and commodities surged 2.26%. This was primarily due to the 4.74% gain in oil and the 1.19% increase in gold prices. The U.S. dollar weakened significantly, falling 1.92% to end the week.
KEY CONSIDERATIONS
Watching the Traffic Lights – The current market environment reminds me of a traffic signal that is flashing multiple lights at the same time. Some areas lean green (bullish), others are more yellow (neutral), and some are even red (bearish). When this is the case, it generally means that there is a lot of uncertainty in the marketplace.
So what areas are currently flashing green lights? For the most part, while it has seen some deterioration over the past month, stock price momentum appears to now be reversing to the upside. The 85-day stochastic indicator that we use to measure market momentum recently hit oversold levels and then reversed.
This jibes well with another indicator that we also track to measure whether the stock market is overbought or oversold. Shown below, this indicator measures the 25-day average price of the S&P 500 stock index and applies overbought and oversold bands around it.
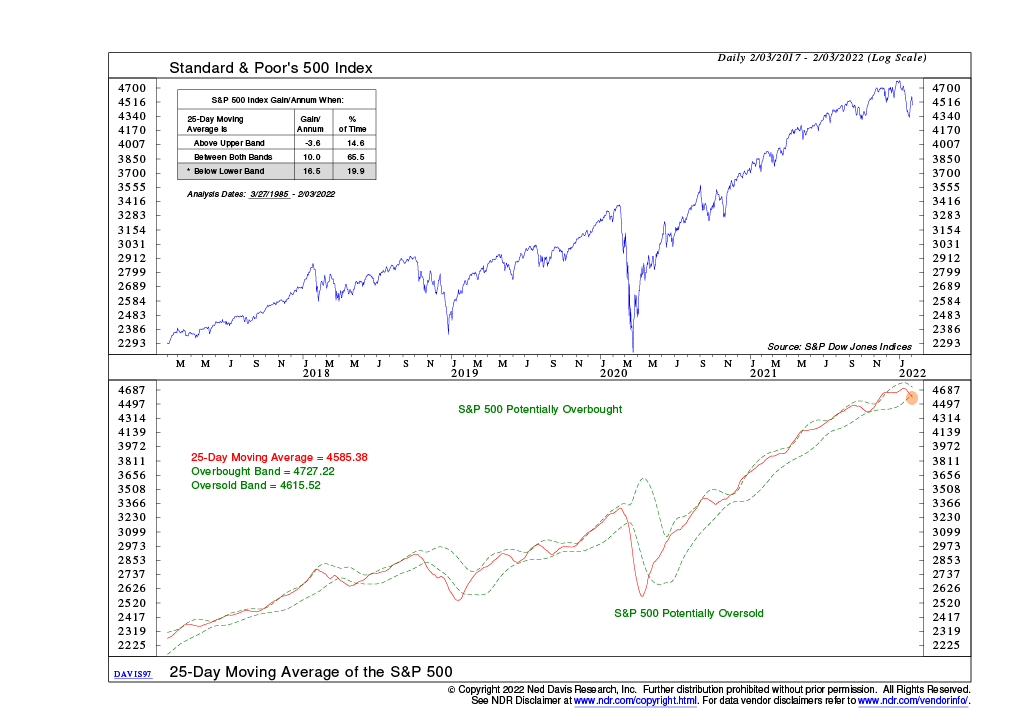
When the S&P 500 drops below the lower band, as it did last week, it’s a warning that stocks have reached potentially oversold levels. Historically, this has been the best-case scenario for stock returns, as it’s a sign that the market has seen enough selling, and now the path of least resistance is to the upside.
As for the yellow lights, there is still probably too much optimism out there to confirm that the market has bottomed with 100% certainty. There are signs of improvement here, but it could certainly be better.
One reason there is still some optimism in the marketplace is due to the fact that the economy is—and is expected to remain—strong. A strong and growing economy is good for corporate profits, which is good for stock prices.
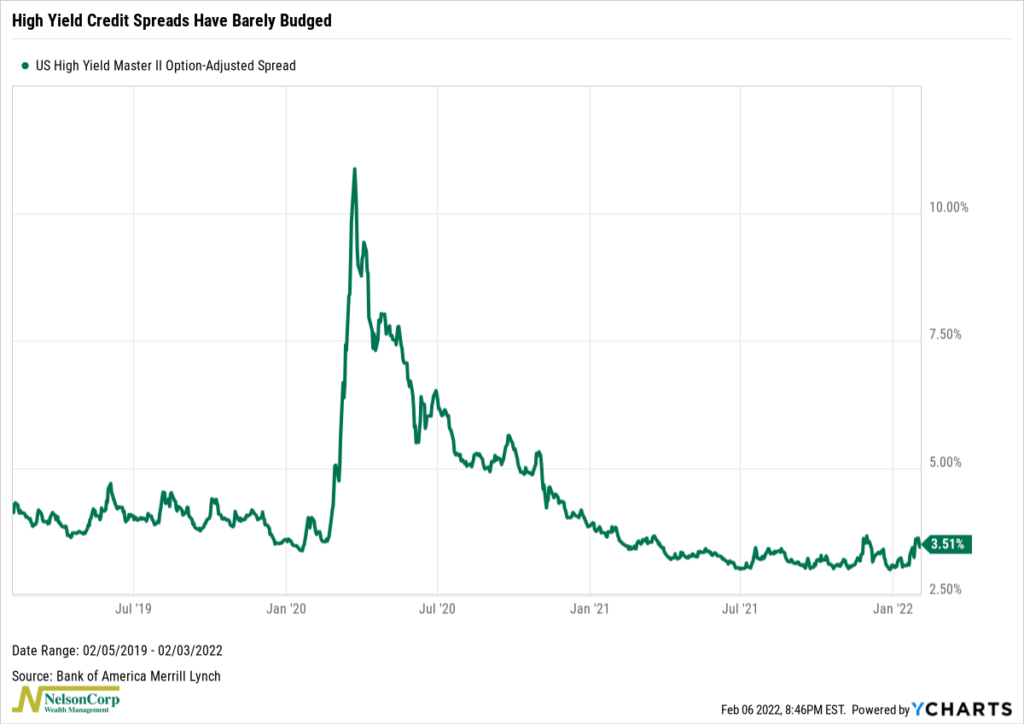
If investors were concerned about a recession or an economic slowdown, we would expect credit spreads to widen, as they have generally done in past recessions. However, as you can see on the chart below, while high yield credit spreads have deteriorated some since the start of the year, this blip is barely perceptible on the chart in the grand scheme of things.
But, and this the probably the biggest issue affecting markets at the moment, there is a big red flashing light coming from the interest rate area of the market. This is because the Federal Reserve will no longer be as accommodative with its monetary policy in 2022 as it has been since the pandemic first began.
With inflation running hotter than expected, the bond markets are now predicting that the Fed will be forced to raise rates as much as five times this year. Higher interest rates mean that the cash flows that companies are expected to generate in the future are worth less today—due to the higher discount rate—so investors tend to reprice stocks to the downside when rates rise.
The chart below shows just how far short-term Treasury rates have risen in recent months as the Fed has turned more hawkish. This is the rate on the 2-year U.S. Treasury bond, which is considered the most sensitive to Federal Reserve policy since the lag between when policy changes are implemented and their effects on the economy is smallest.
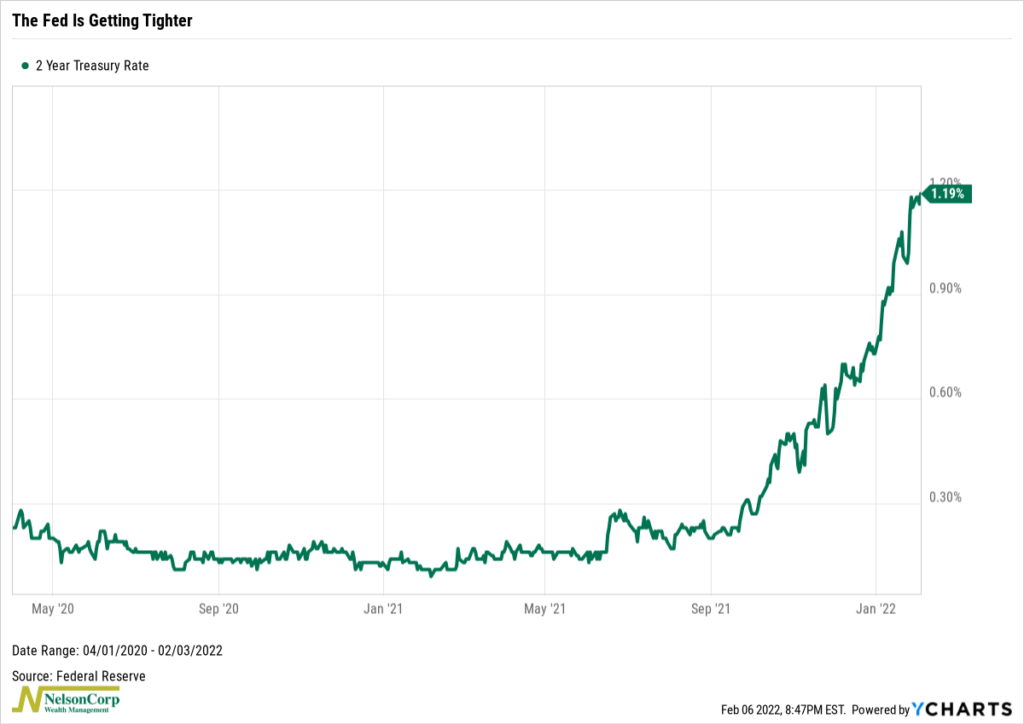
This drastic rise in the 2-year Treasury yield over the past few months is an obvious sign that the Fed is turning tighter, which means liquidity is draining away from the economy. Typically, this is a bearish sign for the stock market.
So, it’s clear that there is a lot of uncertainty in the market this year, probably more so than we had last year. Given these conflicting traffic signals, a neutral or more defensive portfolio positioning is generally justified in this type of environment.
This is intended for informational purposes only and should not be used as the primary basis for an investment decision. Consult an advisor for your personal situation.
Indices mentioned are unmanaged, do not incur fees, and cannot be invested into directly.
Past performance does not guarantee future results.
The post Watching the Traffic Lights first appeared on NelsonCorp.com.