OVERVIEW
The Dow Jones Industrial Average rose 5.7% last week, capping its fourth consecutive week of gains and its best four-week stretch since April 2020. The S&P 500 Index rose 4%, notching its best two-week period since November 2020. And pulling up the rear was the Nasdaq Composite gaining 2.2%, extending its winning streak to two weeks.
Foreign stocks, however, were mixed in performance. The MSCI EAFE Index of developed country stocks rose 4.12%, but the MSCI EM Index of developing country stocks fell 2.25%.
Bonds, though, had a strong week as the 10-year Treasury yield fell to 4.02% from 4.3% the week prior. Intermediate-term Treasuries rose 1.2%, and long-term Treasuries surged 3.9%. Investment-grade corporate bonds posted gains of nearly 2%, and high-yield (junk) bonds rose 2.4%. TIPS gained 1.2%, and municipal bonds fell slightly by about 0.3%.
Real estate had a solid week, climbing about 6.3%. Commodities posted smaller gains, to the tune of about 0.45% broadly. While oil was up over 3%, gold fell about 0.7%, and corn dropped 0.5%.
And finally, the U.S. dollar weakened around 1.1% for the week.
KEY CONSIDERATIONS
Trust but Verify – The U.S. stock market, which we measure using the S&P 500 Index, has rallied nicely over the past couple of weeks. Since the weekly closing low of 3583, the S&P has gained nearly 9%. That puts the index just above its average 50-day price (orange line), as the chart below shows.
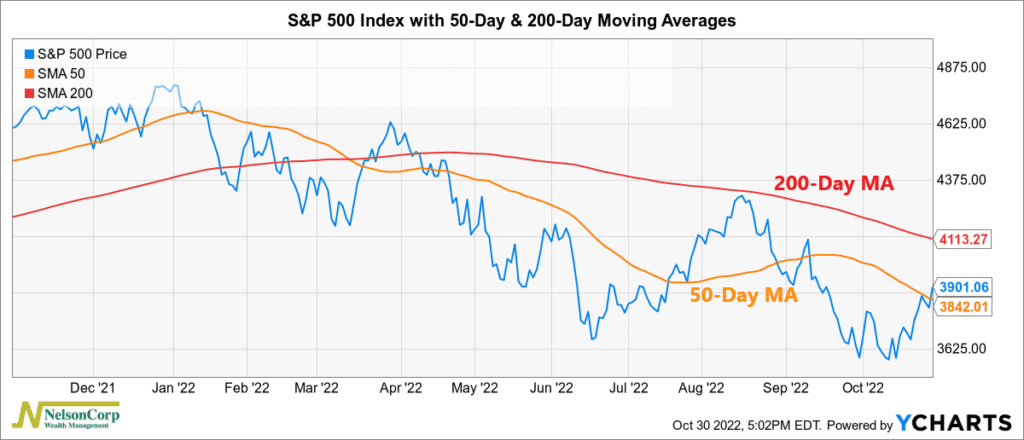
But, as you might notice, the S&P is also still well below its average 200-day price (red line), to the tune of roughly 5.5%.
So, given the weight of the evidence, I’d say that the technical picture for stocks still looks a bit murky right now. Honestly, it’s too early to tell whether the recent rally has any legs, as the market low was just a couple of weeks ago.
However, if you are looking for an early sign of market strength, the Three-Day Price Thrust indicator, shown on the chart below, triggered a buy signal last week.
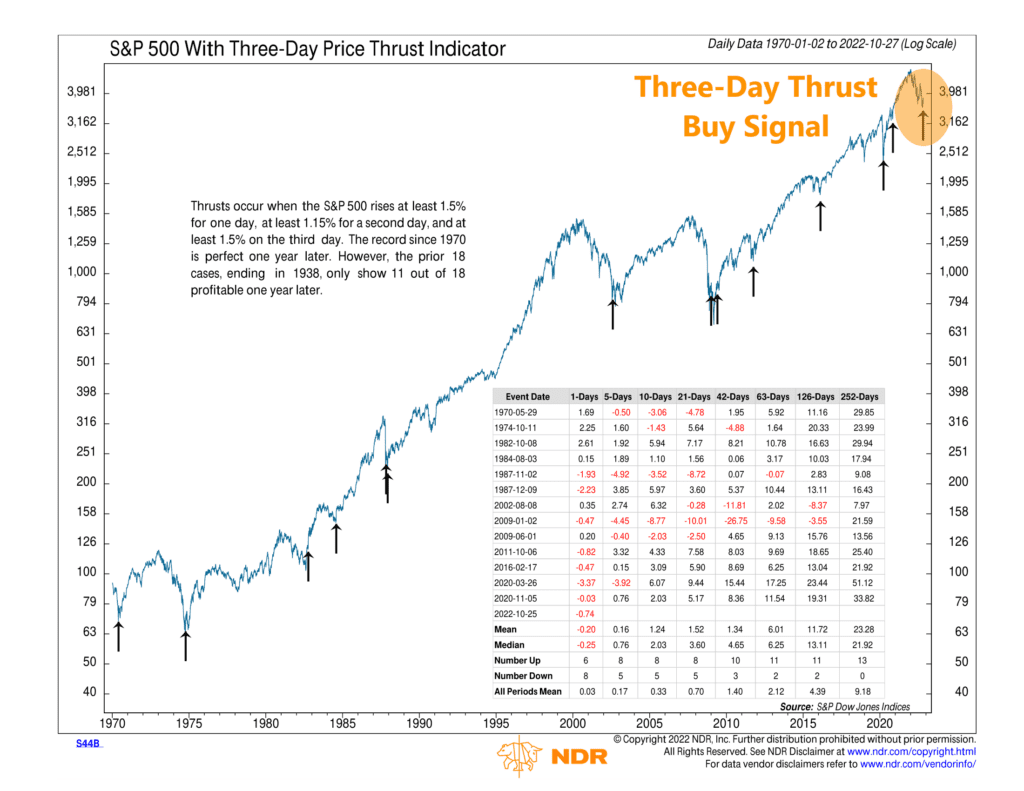
This indicator identifies when a three-day thrust occurs in the stock market. Specifically, it triggers a buy signal when the S&P 500 Index rises at least 1.5% for one day, at least 1.15% for a second day, and at least 1.5% on the third day.
This is a rare but somewhat reliable indicator that is worth taking notice of. Historically, as you can see on the chart, these types of thrust signals tend to occur near the bottom of major stock market selloffs.
With that said, however, we like to take a “trust but verify” approach with these short-term technical indicators. That’s because there’s still a lot of uncertainty out there, particularly when it comes to the many external factors affecting the stock market—like the macro environment and Fed policy.
Take the money supply, for example, which combines both Fed policy and organic economic activity.
The chart below shows the year-over-year change in the M2 money supply—a commonly used measure of the broad money supply in the U.S. economy.
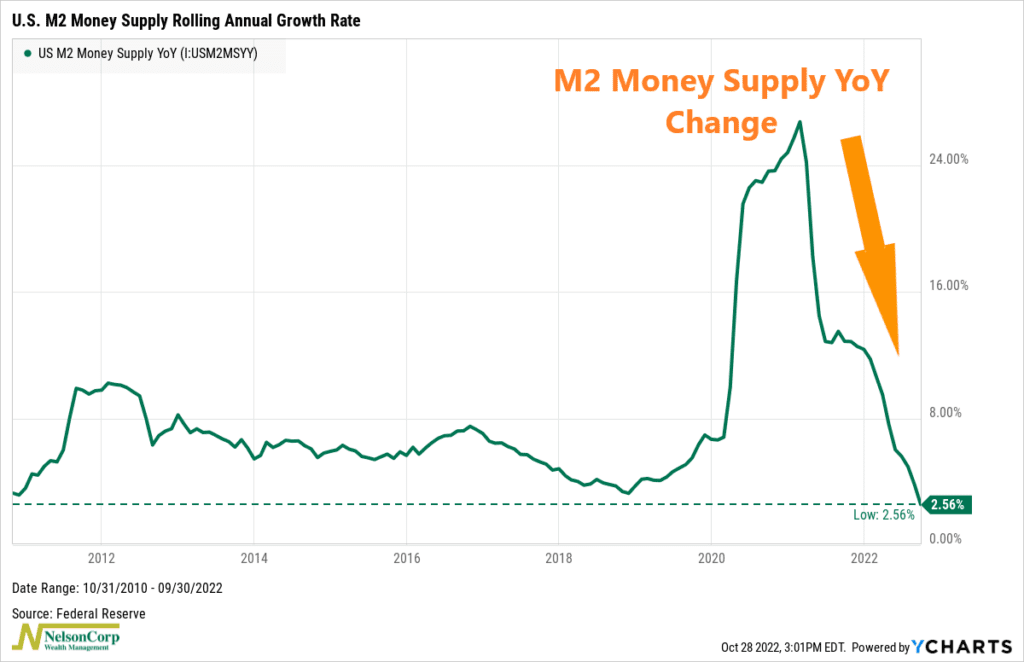
You can see how it spiked to an annual growth rate peak of nearly 27% in 2021. But then the Fed started tightening its proverbial monetary policy belt, and the yearly growth rate has fallen to roughly 2.5%—its lowest level in over a decade.
So why do I point this out? Because it’s ambiguous as to how investors might be reading this.
On the one hand, the dramatic fall in the money supply growth rate is akin to a person draining water from a bathtub. As the liquidity in the financial system dries up, it tends to hurt stock prices. This makes a lot of sense and probably explains why the stock market has dropped as much as it has this year.
However, on the other hand, the market might see this as a sign that a lot of the damage from monetary policy tightening has already been done. Now that the money supply is no longer stimulative, investors are hoping that the Fed will pause and wait to see if inflation cools. As a forward-looking machine, the stock market might take that event as bullish news.
The bottom line, though, is that none of this is known for sure. And the market hates uncertainty.
So, for that reason, we will continue to monitor our indicators and wait for the overall weight of the evidence to shift before trusting any potential trend reversals.
This is intended for informational purposes only and should not be used as the primary basis for an investment decision. Consult an advisor for your personal situation.
Indices mentioned are unmanaged, do not incur fees, and cannot be invested into directly.
Past performance does not guarantee future results.
The post Trust but Verify first appeared on NelsonCorp.com.