OVERVIEW
U.S. stocks got tripped up again last week as the major indices fell for a second week in a row. The S&P 500 lost 0.57%, the Dow dropped 0.07%, and the Nasdaq fell 0.47%.
International stocks didn’t hold up any better. Developed country stocks fell 1.38%, and emerging market stocks tumbled 2.26%.
Bond performance was mixed for the mix. While short- and intermediate-term Treasuries saw slight declines, long-term Treasuries gained 0.43% on the week. Investment-grade corporate bonds rose 0.08%, and high-yield (junk) bonds gained 0.14%. Municipal bonds were flat for the week, and inflation-protected Treasuries (TIPS) declined 0.34%.
Real estate was unchanged, whereas commodities gained about 0.45% on the week. Oil had a big gain of over 3%, but gold declined roughly 2.3%. And the U.S. dollar strengthened by about 0.6% to end the week.
KEY CONSIDERATIONS
Testing Support – U.S. stocks felt the selling pressure again last week. The S&P 500 index registered its second consecutive week of negative returns—which, believe it or not, was only the third time that has happened this year.
This recent price weakness has left the S&P 500 index once again testing a key level of support: its 50-day moving average. The 50-day moving average is a line that tracks the average price of the index over the previous 50 trading days. Stocks have tested this support level multiple times this year, and each time it held up as buyers rushed in to “buy the dip” in earnest.
Here’s a chart of the S&P 500 with its 50-day moving average (orange dashed line).
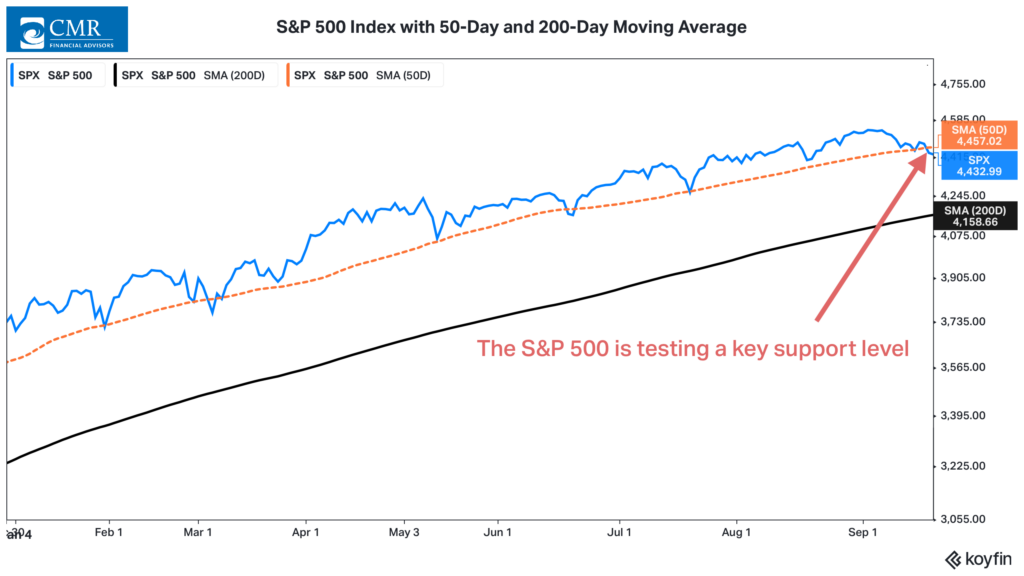
You can see how the S&P 500 bounced off this key support level after every selloff this year. That’s why this next week of trading will be important for stocks. A breakdown below this level could lead to more short-term selling.
At that point, we might want to turn our focus to the 200-day moving average, shown as the black line on the chart. This is considered a longer-term support level. Right now, though, the line itself is still trending upwards, so that is a good sign for the longer-term health of this bull market.
As of last Friday’s close, the 200-day moving average is about 6% lower than the current level of the S&P 500. A fall to the 200-day moving average would put the index in a roughly 8% drawdown. At that point, a correction (decline of 10% or more) would be within throwing distance.
So that’s the kind of road map we’re looking at right now. Whether we get a selloff into correction territory will depend in some part on these various key price levels and whether enough buying power is present to support the dip.
This is intended for informational purposes only and should not be used as the primary basis for an investment decision. Consult an advisor for your personal situation.
Indices mentioned are unmanaged, do not incur fees, and cannot be invested into directly.
Past performance does not guarantee future results.
The post Testing Support first appeared on NelsonCorp.com.