OVERVIEW
The U.S. stock market took a beating last week as the S&P 500 index fell 4.78 percent amid rising volatility.
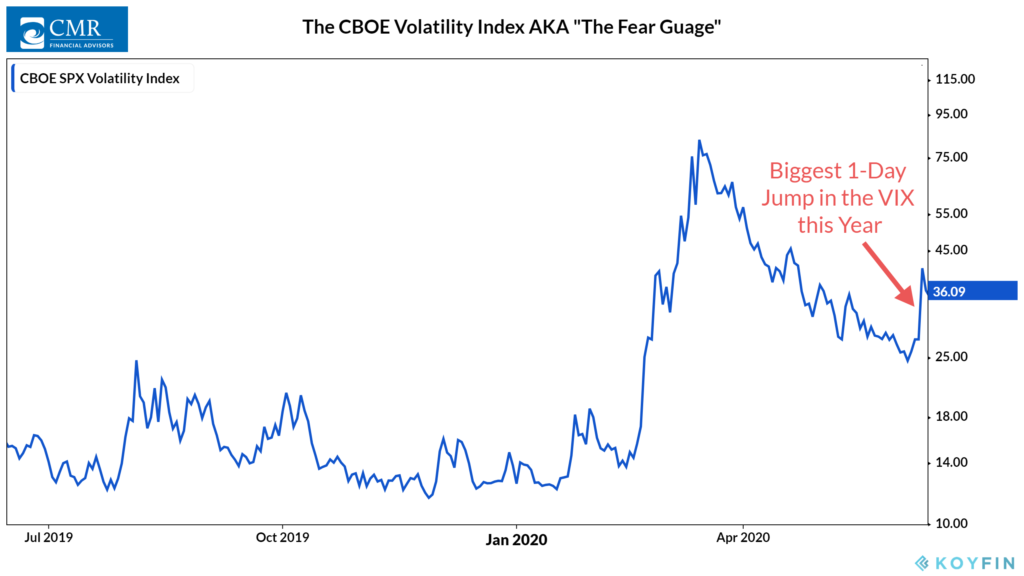
The VIX index, a measure of stock market volatility, rose nearly 48 percent last Thursday alone, it’s largest one-day jump all year.
The financial and energy sectors were hit particularly hard due to the drop in Treasury yields and falling oil prices.
In line with U.S. stocks, developed country stocks fell 4.24 percent, but emerging market stocks dropped just 1.56 percent.
The fall in Treasury yields boosted the return of long-term Treasuries by roughly 4.5 percent.
Investment-grade corporate bonds also did well, rising about 0.45 percent. High-yield corporate bonds, however, dropped nearly 1.4 percent for the week.
Real estate sold off by more than 4.5 percent, and commodities fell roughly 1.5 percent as oil prices dropped by more than eight percent.
The U.S. dollar remained mostly flat, gaining just a tenth of a percent for the week.
KEY CONSIDERATIONS
Stocks Take a Tumble… Risk Measures Improve – Going into last week, the stock market had just recorded its biggest 50-day rally in history. The VIX index, which measures stock market volatility via options, had fallen (and stayed) below a reading of 30 for more than three straight weeks.
But then, Thursday brought a massive sell-off in risk assets. Volatility skyrocketed. The VIX index shot up to more than 40, a one-day increase of nearly 48 percent. Stocks fell almost 5.9 percent that day.
If March had never happened, it would have felt like a more significant downturn. Instead, it was just the 4th largest decline of the year.
Despite the S&P 500’s weekly decline of roughly 4.8 percent, our models saw improvements in a few non-price-based risk measures.
For one, high-yield bond spreads have continued to come down. Although they did pick up slightly over the past few weeks, they are still in a downward trend, registering lower yields than just a month ago.

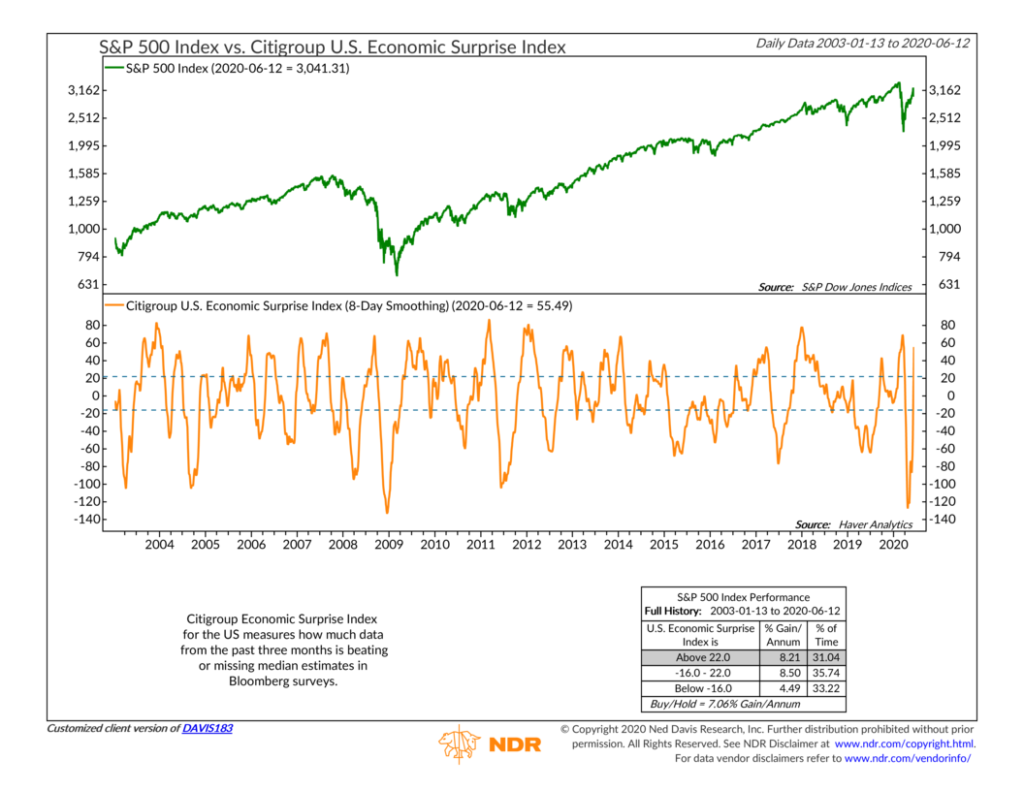
More so, the Citigroup U.S. Economic Surprise Index has improved dramatically over the past few weeks. This measure jumped from a bearish to a bullish signal last week, a sign that the recent economic data, while bad, has not been as poor as many had thought it would be.
From a sentiment perspective, when the market rallies as hard as it has over the past couple of months, we get concerned that optimism has gotten out of hand, a sign of overbought conditions.
Going into last week, this was perhaps the case, as various sentimental measures were signaling levels of excessive optimism (a bearish condition). However, after the decline, sentiment improved a bit.
The Hulbert Newsletter Stock Sentiment Index tracks the average stock exposure among investors who focus on timing the stock market’s short-term movements. This measure recently reached its highest level since February. But after the wash-out last week, it dipped back into neutral territory.
These improvements could undoubtedly prove to be short-lived, and this recent downturn could certainly turn into a more extensive correction. However, although returns are likely to be choppy with volatility at current levels, the weight of the evidence is suggesting a more bullish risk environment at this time.
This is intended for informational purposes only and should not be used as the primary basis for an investment decision. Consult an advisor for your personal situation.
Indices mentioned are unmanaged, do not incur fees, and cannot be invested into directly.
Past performance does not guarantee future results.
The post Stocks Take a Tumble…Risk Measures Improve first appeared on NelsonCorp.com.